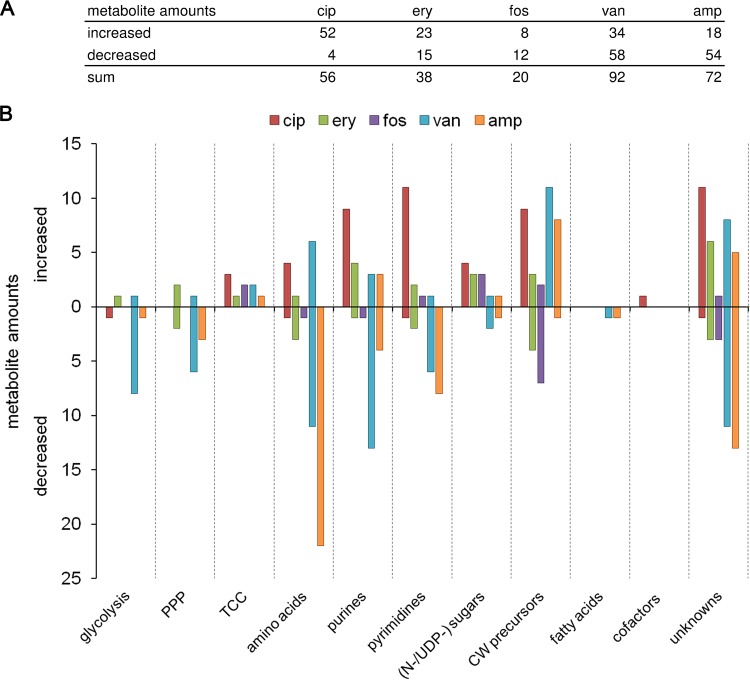
FIG 2.
(A) Table showing numbers of intracellular metabolites with significantly (P ≤ 0.01) enhanced and decreased fold changes (FC stress compared to FC control) within 120 min of antibiotic treatment and within 30 min of vancomycin treatment. Data are based on mean values for quintuplicate samples. (B) Bar chart displaying significantly altered metabolite numbers from panel A sorted by the respective metabolic pathways. Columns are colored according to the antibiotic stress: red, ciprofloxacin; green, erythromycin; purple, fosfomycin; blue, vancomycin; and orange, ampicillin. PPP, pentose phosphate pathway; TCC, tricarboxylic acid cycle, (N-/UDP-) sugars, amino sugars/UDP-activated sugars; CW, cell wall.

