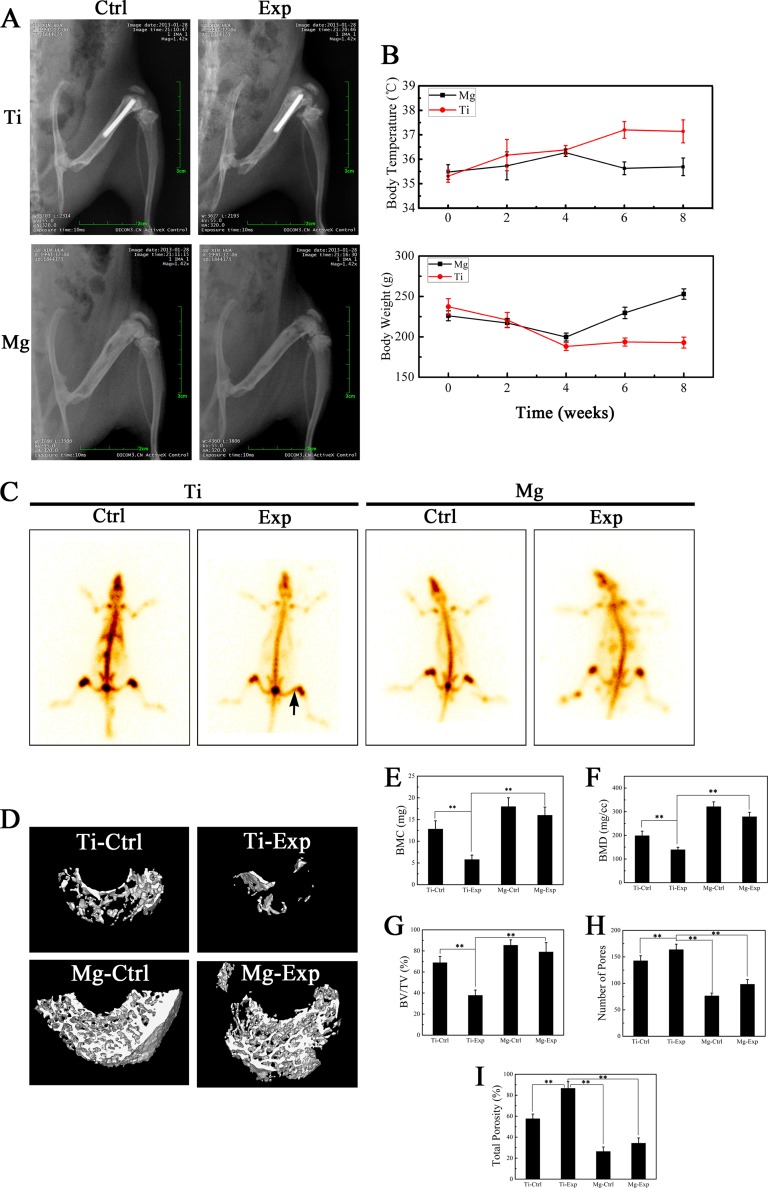
FIG 2.
(A) X-ray digital films in posterior-anterior view of four rat groups 8 weeks after surgery. (B) Changes in body weight and temperature of animals. (C) 99mTc radioactivity emission computerized tomographic (ECT) images of four rat groups 8 weeks after surgery. (D) Representative micro-computerized tomography (CT) 3D reconstructed images obtained for each group. Bone mineral content (BMC) (E), bone mineral density (BMD) (F), body volume/tissue volume (BV/TV) (G), number of pores (H), and the percentage of total porosity (I) of each group sample were analyzed. Values are means ± SD. *, P < 0.05; **, P < 0.01.

