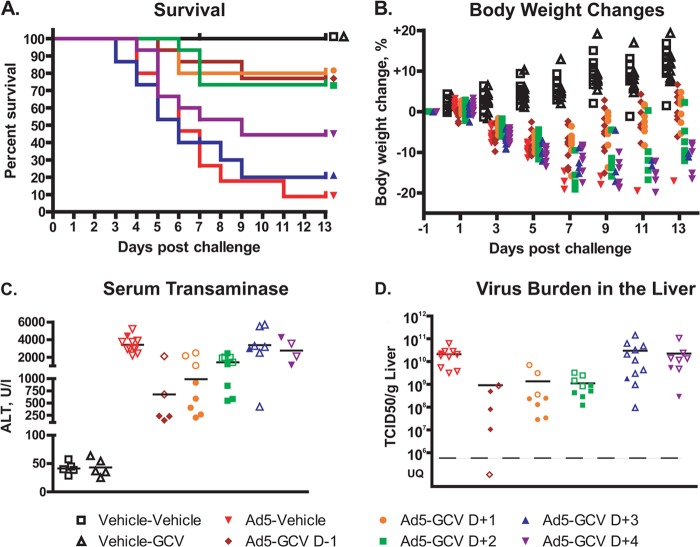
FIG 2.
Ganciclovir reduces mortality and morbidity even when administered 2 days after virus challenge. (A) Survival (n = 15). For Ad5-vehicle versus Ad5-GCV on day −1 (D−1), day +1 (D+1), and day +2 (D+2), P < 0.001; for Ad5-vehicle versus Ad5-GCV on day +3 (D+3), P = 0.802; and for Ad5-vehicle versus Ad5-GCV on day +4 (D+4), P = 0.083 (log rank test). Symbols placed at the end of each line of this graph help identify the groups that the lines represent. (B) Body weight loss (n = 10). Significance was not computed because of the low number of surviving animals in the Ad5-vehicle group. (C) Serum transaminase levels (n = 5 to 9). For Ad5-vehicle versus Ad5-GCV on day −1, day +1, and day +2, P < 0.01; for Ad5-vehicle versus Ad5-GCV on day +3, P = 0.856; and for Ad5-vehicle versus Ad5-GCV on day +4, P = 0.396 (Mann-Whitney U test). (D) Virus burden in the liver (n = 5 to 9). For Ad5-vehicle versus Ad5-GCV on day −1, day +1, and day +2, P < 0.001; for Ad5-vehicle versus Ad5-GCV on day +3, P = 0.647; and for Ad5-vehicle versus Ad5-GCV on day +4, P = 0.408 (Mann-Whitney U test). For panels B, C, and D, symbols represent data for individual animals. For the Ad5-infected animals, empty symbols represent data collected from an animal sacrificed moribund ahead of schedule. UQ, unquantifiable.

