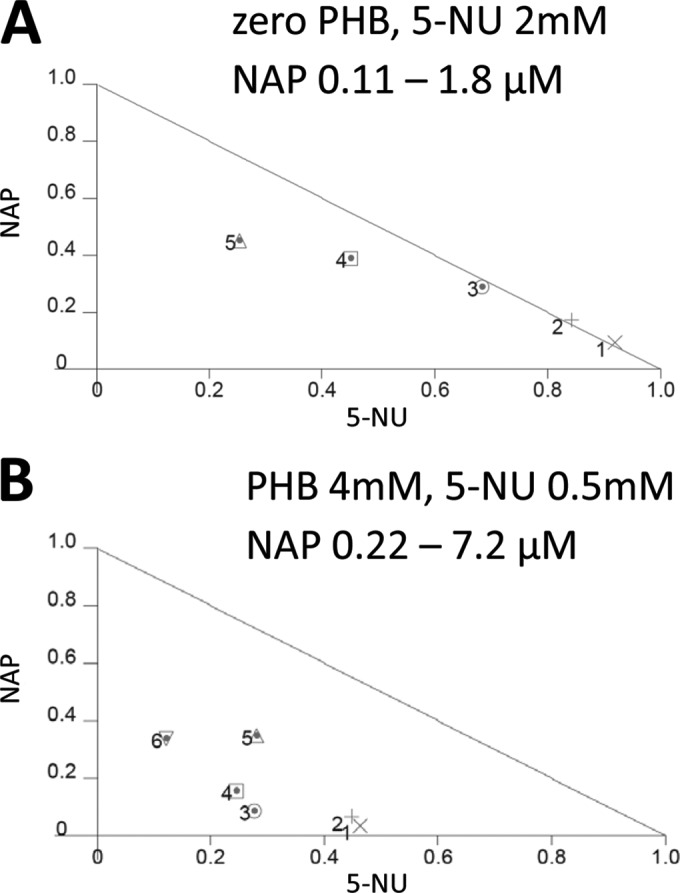
FIG 5.

Representative normalized isobolograms generated by CalcuSyn software describing interactions of naphthalophos (NAP) and 5-nitrouracil (5-NU). (A) Data from an experiment in the absence of PHB, with 5 separate concentrations of NAP and with 5-NU constant at 2 mM. (B) Data from an experiment in the presence of 4 mM PHB, with 6 separate concentrations of NAP and with 5-NU constant at 0.5 mM. The diagonal line is the line of additivity. Experimental data points on, above, and below the line represent additivity, antagonism, and synergism, respectively.
