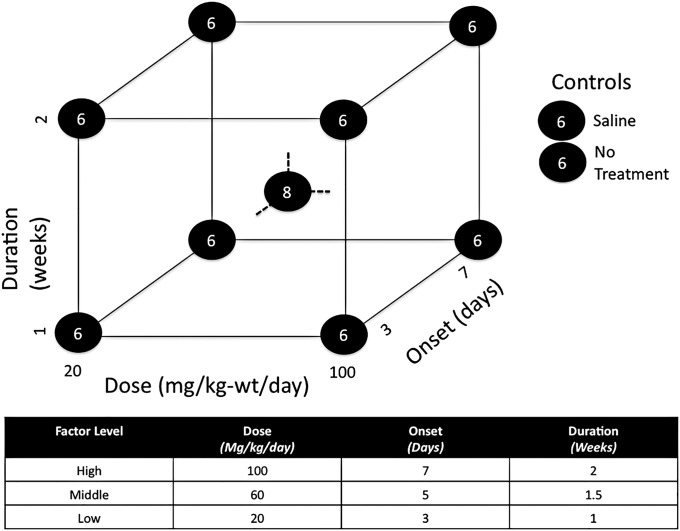
Fig. 1.
Diagram showing the high, middle, and low factor levels for lithium dosing, treatment-onset, and treatment-duration parameters explored in this study. In the screening phase, eight experimental groups were tested at the eight different combinations of high and low factor levels. A ninth group was tested at middle factor levels, while two control groups (receiving no treatment or sham treatment with saline solution) were tested outside the cubic design space.

