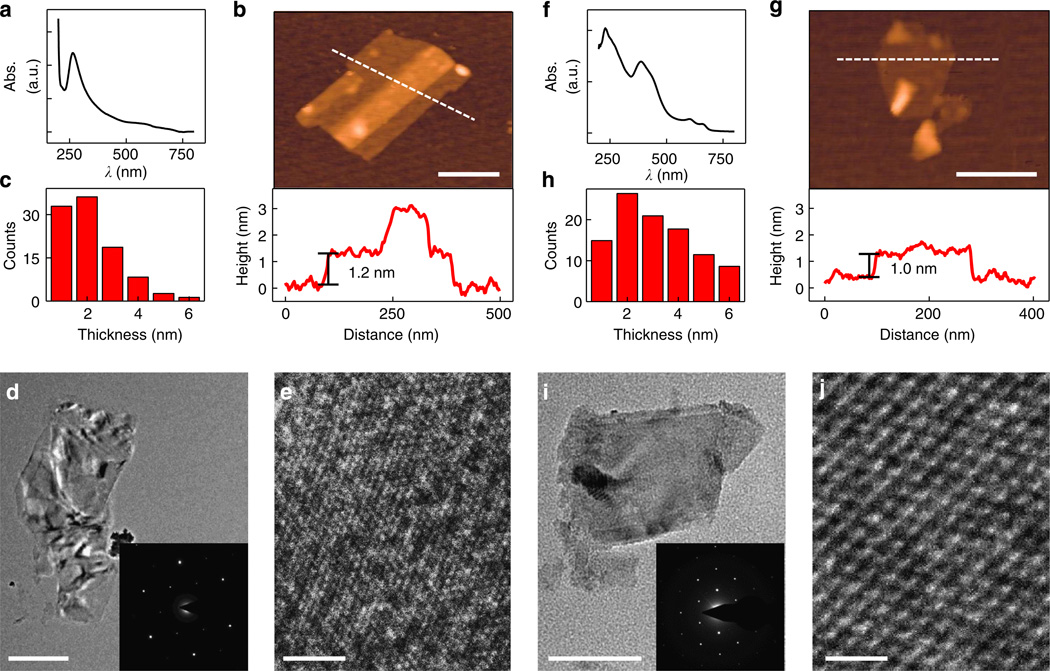
Figure 2. Characterization of the exfoliated LMs.
(a,f) Typical absorption spectra of the exfoliated graphene (a) with a peak absorbance at 260 nm and the exfoliated MoS2 (f) with absorbance peaks at 657, 602 and 385 nm. (b,g) AFM images and section height profiles of the exfoliated graphene (b) and MoS2 (g). (c,h) Sheet thickness distribution of exfoliated graphene (c) and exfoliated MoS2 (h). (d,i) TEM images and ED patterns of few layer graphene (d) and MoS2 (i). (e,j) HRTEM images of the exfoliated graphene (e) with a lattice spacing of 0.265 nm and MoS2 (j) with a lattice spacing of 0.317 nm. Scale bars, 200 nm (b,g), 500 nm (d), 100 nm (i), 1 nm (e,j).

