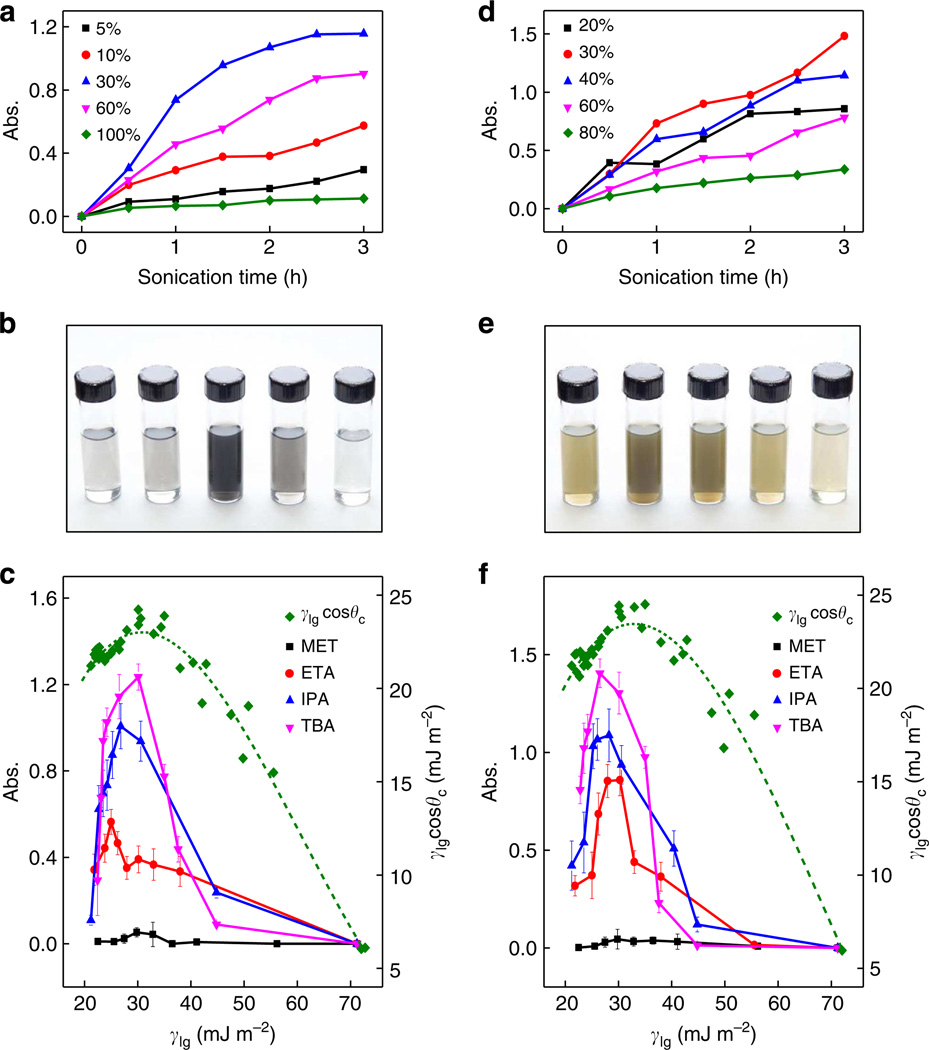
Figure 3. Effect of cosolvent concentration on exfoliation.
(a,d) Absorbance of exfoliated graphite (a) and MoS2 (d) in various concentration of water–IPA cosolvent system as a function of sonication time. (b,e) Photographs of the exfoliated graphene in 5, 10, 30, 60, 100 w% IPA (b) and MoS2 in 20, 30, 40, 60, 80 w% IPA (e) obtained after 3 h of sonication. (c,f) Absorbance of exfoliated graphene (c) and MoS2 (f) in various cosolvent mixture plotted against surface tension (γlg), showing a peak around 25–30 mJ m−2 for both graphite (c) and MoS2 (f). The relation of γlgcosθc versus surface tension (γlg) is also plotted in the graph with the dotted line representing a fitting curve of γlgcosθc as a line guide to the eye.

