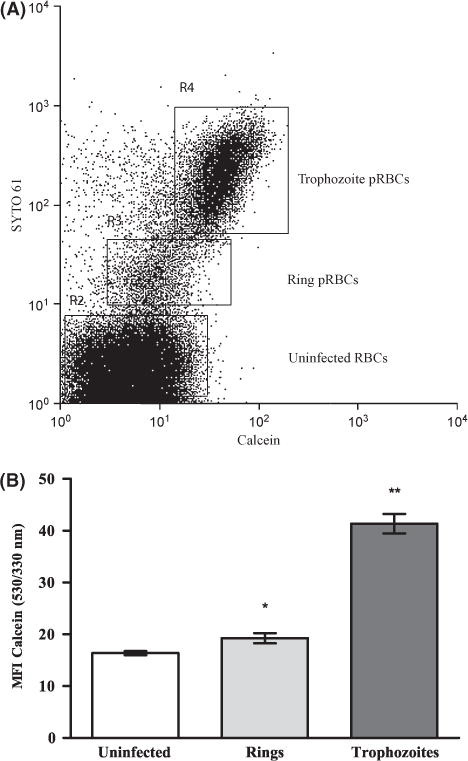
Fig 1.

Measurement of the basal levels of CA-AM fluorescence. Calcein fluorescence of parasitized and uninfected RBCs was determined by assessing the calcein fluorescence of SYTO 61− (uninfected) and SYTO 61 + (parasitized) RBCs. Cells from P. falciparum (FCR3-FMG strain)-infected erythrocyte cultures were seeded in triplicate into a 96-well plate, loaded with CA-AM, and then stained with DNA dye SYTO 61 and analysed by flow cytometry. (A) Dot-plot of cell distribution of DNA stain SYTO 61 vs. calcein reveals the distribution of uninfected RBCs, rings and trophozoites. (B) Gates were set on uninfected RBCs, rings, and trophozoite populations and, mean calcein-fluorescence intensity (MFI) (530/330 nm) was assessed for each population. The bar graph (mean ± SD, n = 3) shows calcein fluorescence of uninfected and parasitized RBCs. Student’s t-test statistical analysis was performed comparing uninfected to parasitized cells, *P < 0·02 **P < 0·0002. Data is from a single representative experiment, and the experiment was performed five independent times with each parasite line, FCR-FMG and Dd2.
