
Figure 3. Best Tumor Response for Each Patient.
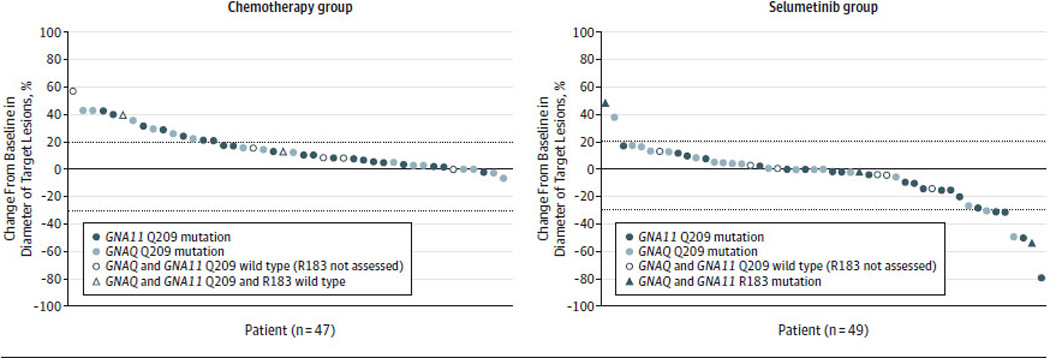
Data regarding the best tumor response observed as of December 31, 2013 are shown for the 47 patients evaluable for response in the chemotherapy group (Panel A) and the 49 patients evaluable for response in the selumetinib group (Panel B) who had undergone at least one tumor assessment after treatment before the clinical cutoff date on December 31, 2013. Each marker represents data for an individual patient. The specific markers indicate the mutational status for GNAQ and GNA11. The percentage change from baseline in the sum of the diameters of the target lesions is shown on the y-axis. Negative values indicate tumor shrinkage. The dotted horizontal lines indicate 20% tumor enlargement consistent with progression of disease by RECIST criteria and 30% tumor shrinkage consistent with a partial response by RECIST criteria. Five patients with tumors wild-type for exon 5 of GNAQ and GNA11 were tested for exon 4 mutations in GNAQ and GNA111 and are indicated by asterisks and triangles.