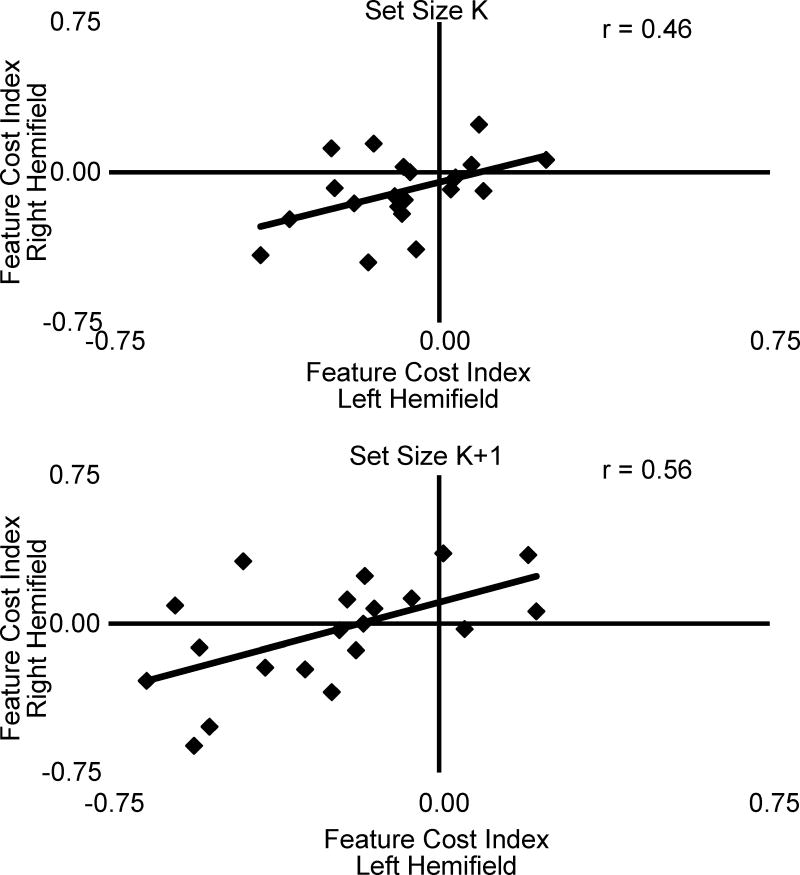
Figure 3.
Relationship between feature cost-indices in the left and right hemifields for set sizes K and K+1. The feature cost-index is a normalized measure of the change in performance for remembering 2 features vs. 1 feature, and was measured in both the left and right visual fields. Correlation between the feature-cost index in left and right hemifields reflects the relationship between resource demand across the visual field.

