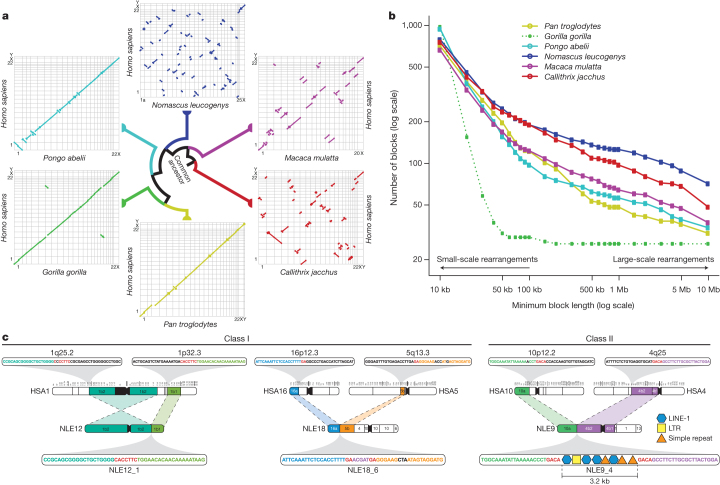
Figure 2. Analysis of gibbon–human synteny and breakpoints.
a, Oxford plots for human chromosomes (y axis) vs. chimpanzee, gorilla, orangutan, gibbon, rhesus macaque and marmoset chromosomes (x axis). Each line represents a collinear block larger than 10 Mb. The gibbon genome displays a significantly larger number of large-scale rearrangements than all the other species. In the gorilla plot, chromosomes 4 and 19 stand out as the product of a reciprocal translocation between chromosomes syntenic to human chromosomes 5 and 17. b, The graph shows the number of collinear blocks in primate genomes with respect to the human genome. The number of collinear blocks is a proxy for the number of rearrangements and decreases as the size of the blocks becomes larger. The gibbon genome has undergone a greater number of large-scale rearrangements; however, the number of small-scale rearrangements is comparable with the other species. The extremely low number of large rearrangements in the gorilla genome (dotted green line) is a reflection of the use of the human genome as a template in the assembly process. c, Examples of gibbon–human synteny breakpoints. The first two are class I breakpoints (that is, base-pair resolution) originated through non-homology based mechanisms. NLE12_1 is the result of an inversion in human chromosome 1 and NLE18_6 is the result of a translocation between human chromosomes 16 and 5 with an untemplated insertion in the gibbon sequence shown in purple; in both cases, micro-homologies in the human sequences are shown in red. The last example (NLE9_4) is a class II breakpoint (3.2 kb) containing a mixture of repetitive sequences.

