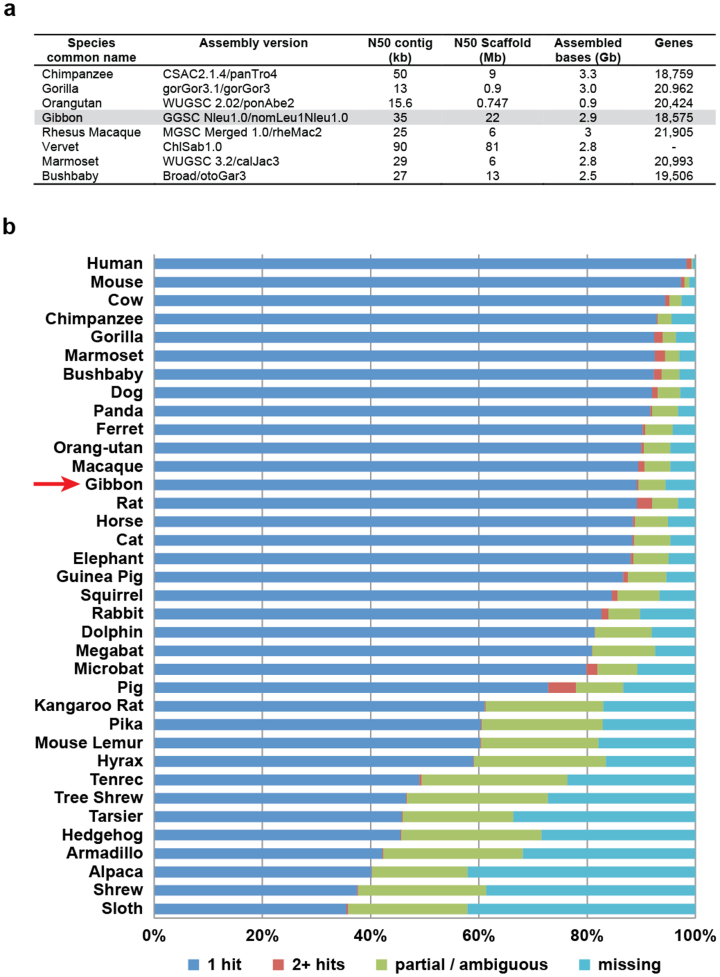
Extended Data Figure 1. The gibbon assembly statistics and quality control.
a, The table compares the gibbon assembly statistics to those of other primates sequenced with a similar strategy. b, The plot represents the percentage of the 10,734 single-copy gene HMMs (hidden Markov models) for which just one gene (blue) is found in the different mammalian genomes in Ensembl 70. Other HMMs match more than one gene (red). The missing HMMs (cyan) either do not match any protein or the score is within the range of what can be expected for unrelated proteins. The remaining category (green) represents HMMs for which the best matching gene scores better than unrelated proteins but not as well as expected. See Supplementary Information section 1.4 for more details.

