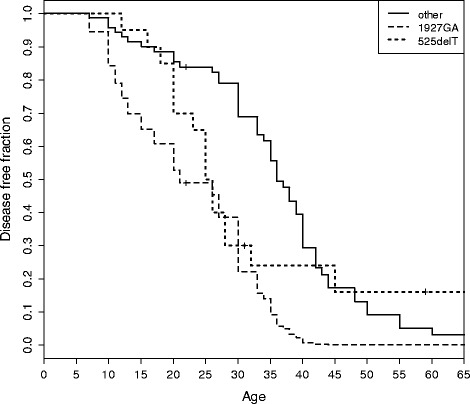
Figure 1.

Comparison of disease-free life among patients with genotypes c.-32-13T > G/c.525delT (n = 21), c.-32-13T > G/c.1927G > A (n = 5), c.-32-13T > G/other (c.2237G > A, Delexon18, VS, PLS) (n = 59). The curve for c.-32-13T > G/c.525delT is a Kaplan-Mayer estimate, the other two are pseudo K-M estimates derived from a Cox model.
