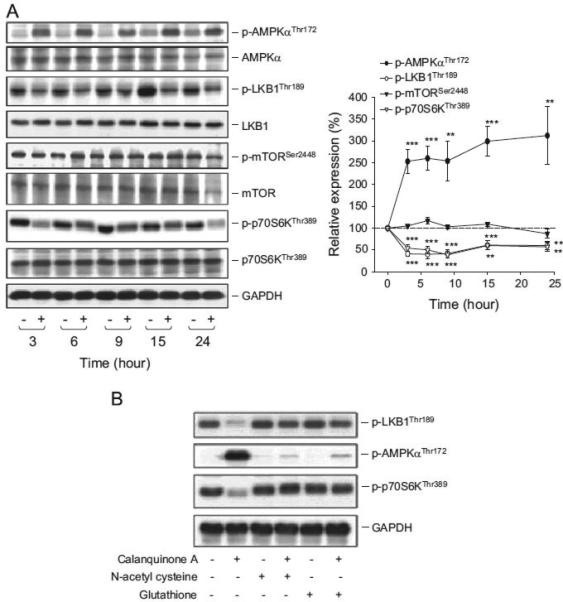
Fig. 6.

Effect of calanquinone A on the regulation of translational pathways. A172 cells were incubated in the absence or presence of calanquinone A (4 μM) for the indicated time (A) or for 3 h (B). The cells were harvested and lysed for the detection of the indicated protein expression by Western blot. The levels of protein expression were quantified using computerized image analysis system ImageQuant (Amersham Biosciences). The data representative of three to four independent experiments and are expressed as mean7S.E.M. nnPo0.01 and nnnP o0.001 compared with the control.
