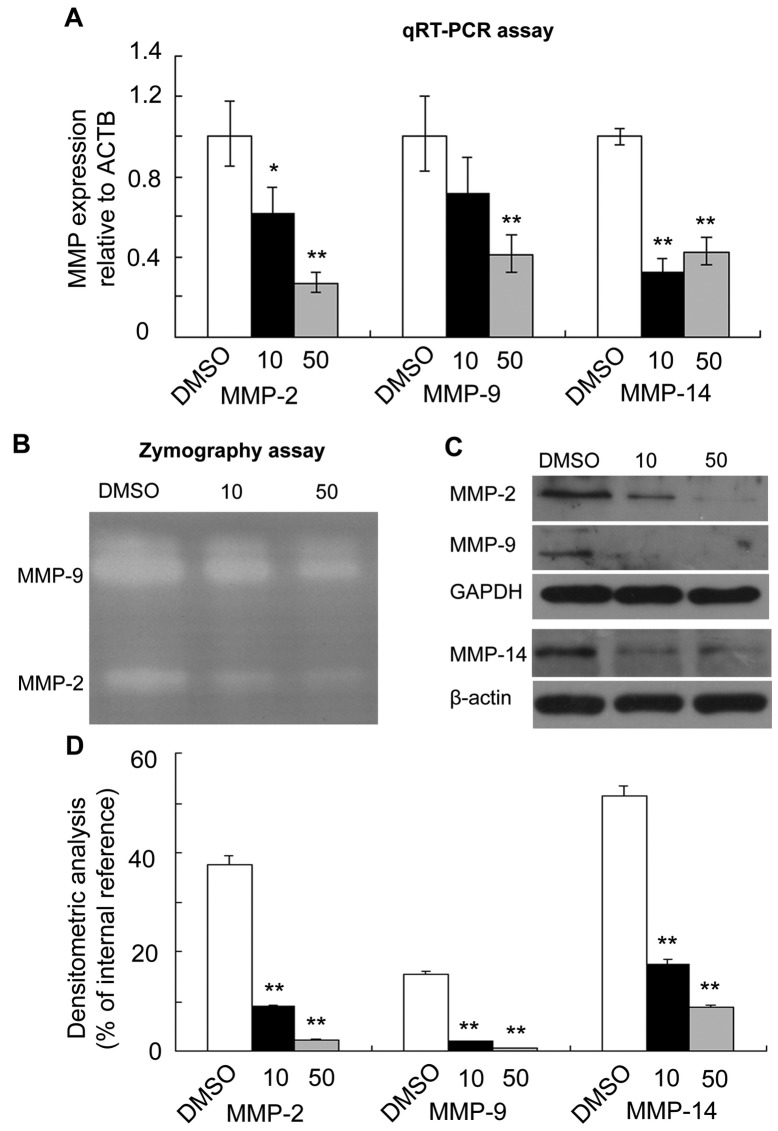
Figure 5.
Effects of scutellarein treatment on the expression of matrix metalloproteinase (MMP)-2, -9 and -14. (A) mRNA expression of MMPs analyzed by RT-qPCR. The relative gene expression levels were calculated using the 2−ΔΔCT analysis tool. Data are presented as the expression of MMPs compared to ACTB. (B) Representative zymographic analysis of MMP-2 and MMP-9 secreted by treated HT1080 cells. (C) Expression levels of MMPs in the treated cells analyzed by western bolt analysis. (D) Representative densitometric analysis of MMP expression by western blot analysis. β-actin and GAPDH were used as internal references in western blot analysis. The values are the means ± SEM (n=3). *P<0.05, **P<0.01.

