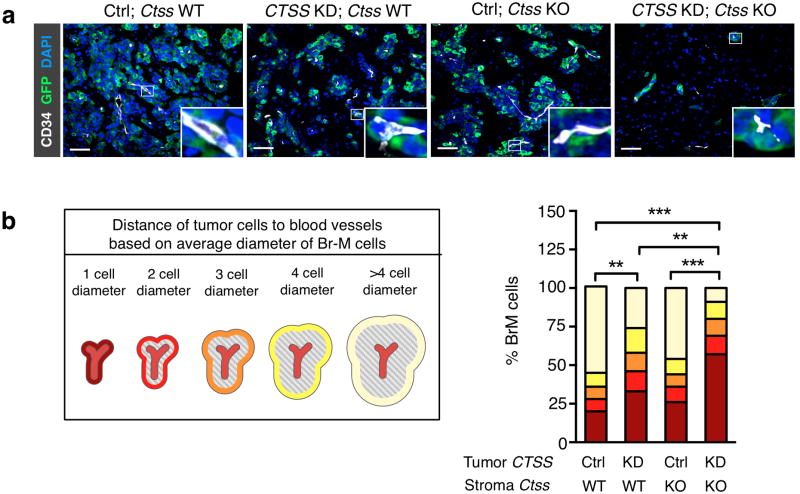
Figure 5. Cathepsin S deficiency in tumor cells and macrophages impairs metastatic seeding and outgrowth.
(a) Representative images of brain metastases (day 35) stained for GFP (tumor cells; green), the endothelial cell marker CD34 (white), and DAPI to visualize nuclei (blue). Scale bar indicates 50 μm. Images are representative of independent specimens quantified in (b). (b) GFP+ tumor cells were categorized based on their localization relative to blood vessels, defined as the distance of tumor cells from blood vessels (1 to >4 average tumor cell diameter), and the percentage of tumor cells in each defined area was quantified using Metamorph image analysis software. Ctrl; Ctss WT (n=4 mice), CTSS KD; Ctss WT (n=6 mice), Ctrl; Ctss KO (n=6 mice), and CTSS KD; Ctss KO (n=6 mice). Categorical data are plotted as stacked bars. P values were obtained with an ordinal Chi-square test for categorical data. **P<0.01 and ***P<0.001.

