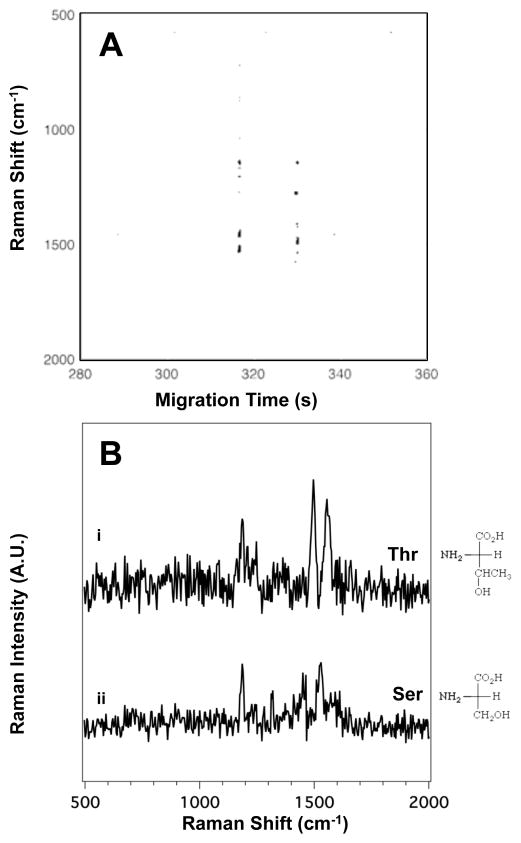
Figure 6.
(A) The SERS electropherogram of the two alcoholic amino acids indicates that Thr migrates at tm = 320 ± 13 s and Ser at tm = 330 ± 15 s. The signal threshold (>4σ) was set to 960 counts. (B) Averaged SERS spectra of (i) Thr and (ii) Ser were extracted from the electropherogram in (A) between 316.2 and 317.0 s, and 329.4 and 329.1 s, respectively. The amino acid concentration in this mixture is 5.0×10⁻⁴ M.

