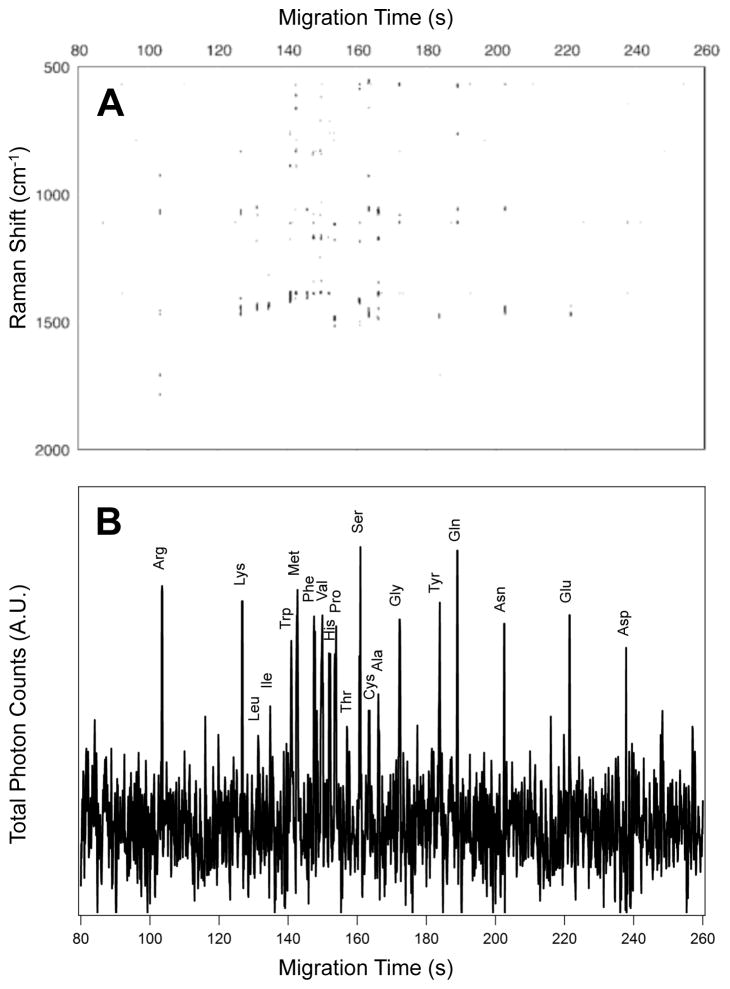
Figure 7.
(A) The SERS electropherogram following the electrophoretic separation of the twenty proteinogenic L-amino acids indicates that Arg migrates at tm = 108.8 s, Lys migrates at tm = 110.2 s, Leu migrates at tm = 112.1 s, Ile migrates at tm = 113.1 s, Trp migrates at tm = 116.9 s, Met migrates at tm = 119.7 s, Phe migrates at tm = 121.0 s, Val migrates at tm = 124.3 s, His migrates at tm = 126.7 s, Pro migrates at tm = 127.6 s, Thr migrates at tm = 129.1 s, Ser migrates at tm = 131.5 s, Cys migrates at tm = 132.2 s, Ala migrates at tm = 134.8 s, Gly migrates at tm = 136.5 s, Tyr migrates at tm = 176.2 s, Gln migrates at tm = 180.7 s, Asn migrates at tm = 194.6 s, Glu migrates at tm = 207.6 s, and Asp migrates at tm = 214.2 s. The signal threshold (>4σ) was set to 1250 counts. (B) Total photon electropherogram (TPE) showing the photons detected at all Raman shifts as a function of migration time. The concentration of each amino acid in this mixture is 5.0×10⁻⁵ M. The SERS signal generated by the elution of each amino acid in the detection volume persists for less than 500 ms at these concentrations.

