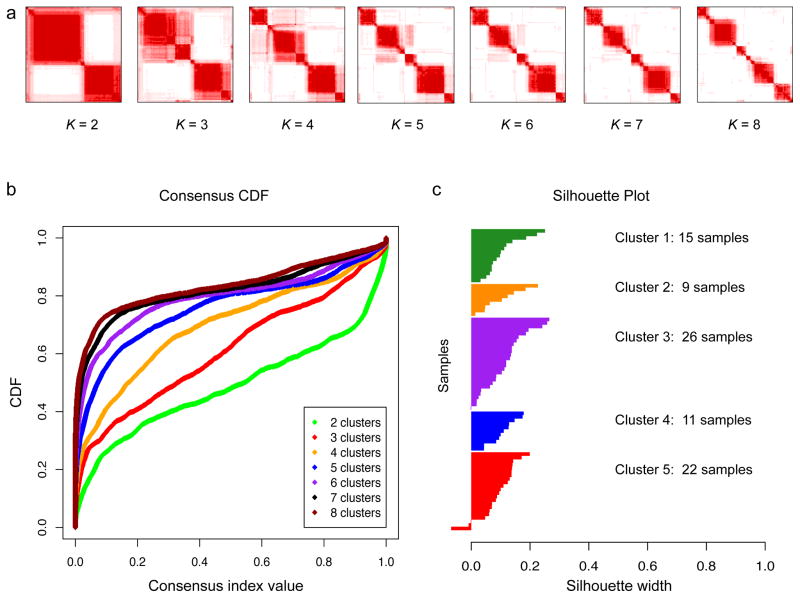
Extended Data Figure 9. Consensus matrices, the empirical cumulative distribution function (CDF) plot and core sample identification.
a, Consensus matrices of the 90 CRC samples for k = 2 to k = 8. The consensus matrices show the robustness of the discovered clusters to sampling variability (resampling 80% samples) for cluster numbers k = 2 to 8. In each consensus matrix, both the rows and the columns were indexed with the same sample order and samples belonging to the same cluster frequently are adjacent to each other. For each pair of samples, a consensus index, which is the percentage of times they belong to the same cluster during 1,000 runs of the clustering algorithm based on resampling was calculated. The consensus index for each pair of samples was represented by color gradient from white (0%) to red (100%) in the consensus matrix. b, CDF plots corresponding to the consensus matrices for k = 2 to k = 8. This plot shows the cumulative distribution of the entries of the consensus matrices within the 0–1 range. Skew toward 0 and 1 indicates good clustering. As k increases, the area under the CDF is hypothesized to increase markedly until k reaches the ktrue. In this case, 7 was considered as ktrue because the change of the area under the CDF was close to zero when k increased from 7 to 8. c, Silhouette plot for core sample identification. For each sample (y-axis), the silhouette width (x-axis) compares its similarity to its assigned class and to any other classes. Samples with higher similarity to their assigned class than to any other classes will get positive silhouette width score and be selected as core samples.

