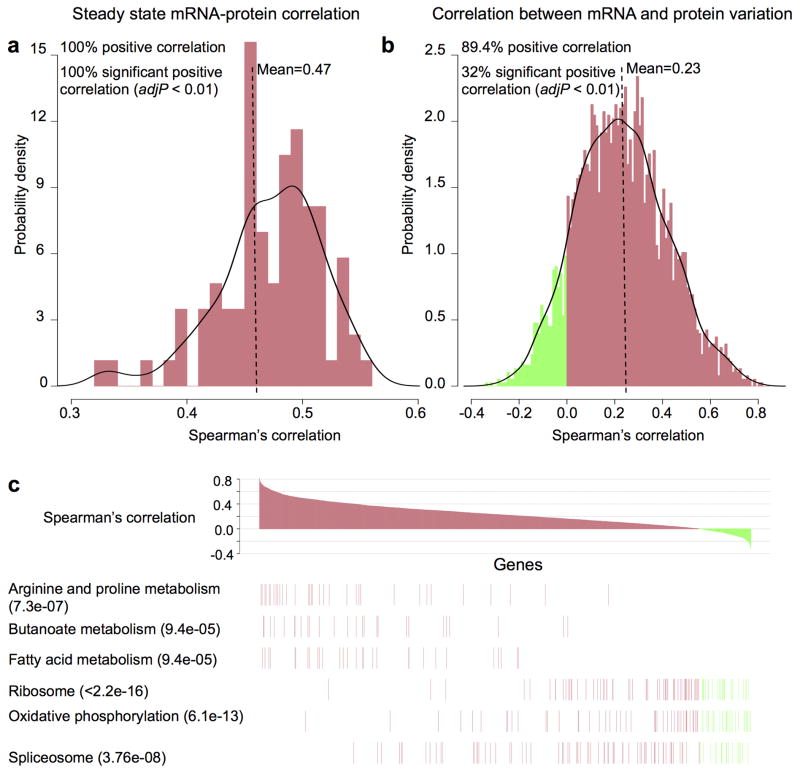
Figure 2. Correlations between mRNA and protein abundance in TCGA tumors.
a, Steady state mRNA and protein abundance were positively correlated in all 86 samples (multiple-test adjusted p value < 0.01) with a mean Spearman’s correlation coefficient of 0.47. b, mRNA and protein variation were positively correlated for most (89.4%) mRNA-protein pairs across the 87 samples, but only 32% showed significant correlation (multiple-test adjusted p value < 0.01), with a mean Spearman’s correlation coefficient of 0.23. c, mRNA and protein levels displayed dramatically different correlation for genes involved in different biological processes. Genes encoding intermediary metabolism functions showed high mRNA-protein correlations, whereas genes involved in oxidative phosphorylation, RNA splicing and ribosome components showed low or negative correlations. Multiple-test adjusted two-sided p-values from the Kolmogorov-Smirnov test were provided in the parentheses following the KEGG pathway names. Red and green in the figures indicate positive- and negative-correlations, respectively.

