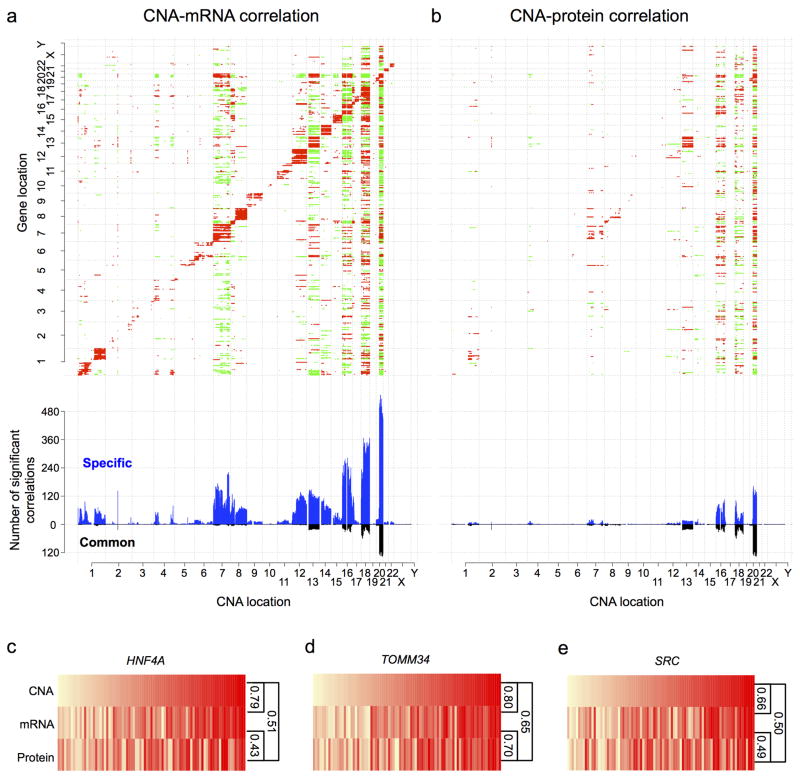
Figure 3. Effects of copy number alterations (CNAs) on mRNA and protein abundance.
a,b, The top panels show copy number-abundance correlation matrices for mRNA abundance (a) and protein abundance (b) with significant positive and negative correlations (multiple-test adjusted p value < 0.01, Spearman’s correlation coefficient) indicated by red and green colors, respectively, and genes ordered by chromosomal location on both x and y-axes. The bottom panels show the frequency of mRNAs/proteins associated with a particular copy number alteration, where blue and black bars represent associations specific to mRNA/protein or common to both mRNA and protein, respectively. c–e, HNF4A, TOMM34 and SRC showed significant CNA-mRNA, mRNA-protein, and CNA-protein correlations (Spearman’s correlation coefficient). The color grade from light yellow to red indicates relatively low-level to high-level CNA, relative mRNA abundance or relative protein abundance among the 85 samples, which were ordered by copy number data.

