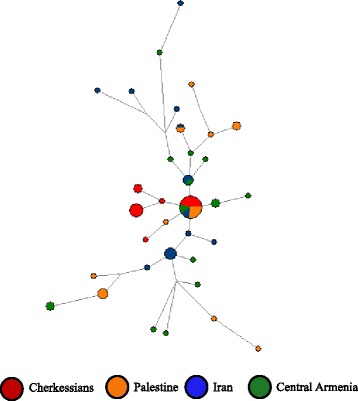
Figure 7.

Median-joining network of microsatellite haplotypes within the haplogroup G. Circles represent microsatellite haplotypes, the areas of the circles are proportional to haplotype frequency (smallest circle corresponds to one individual), and population is indicated by color.
