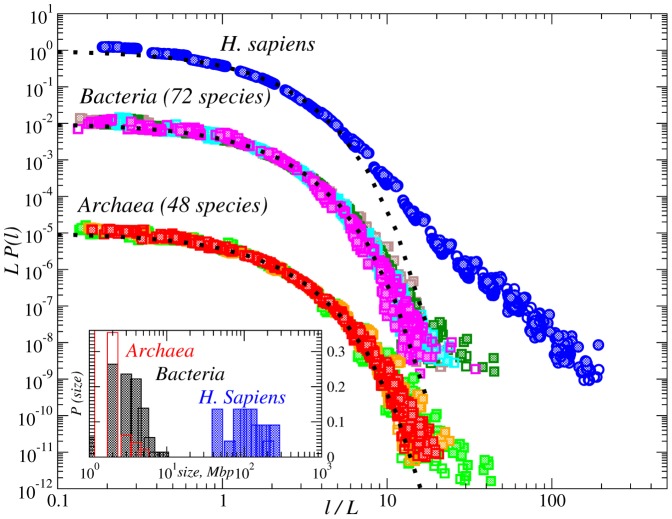
Figure 2. PDFs of the inter-nucleotide intervals A-A, T-T (open symbols); G-G, C-C (full symbols) in the DNA sequences from Archaea ( ) (48 species), Bacteria (
 ) (72 species) and H. Sapiens (
 ) (22 chromosomes).
For comparison, dotted lines show corresponding exponential PDFs. The inset shows the size distribution plots of the DNA sequences considered.

