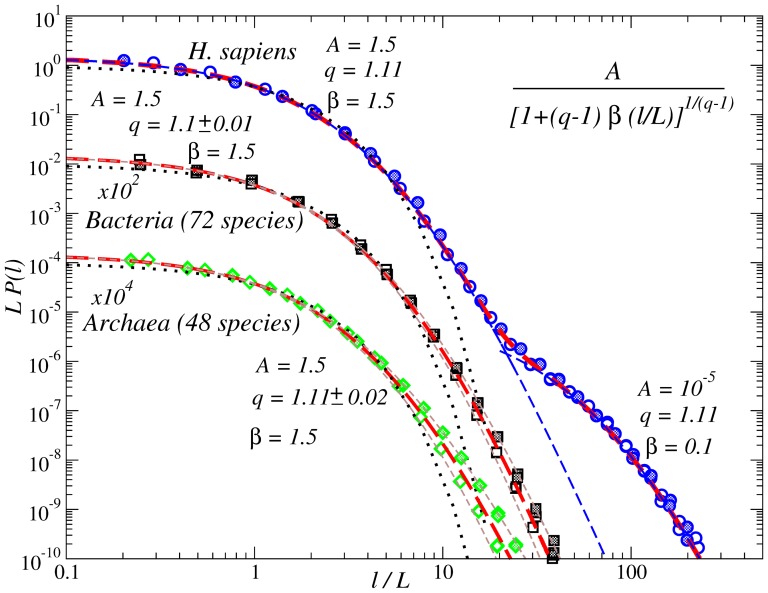
Figure 3. PDFs of the inter-nucleotide intervals A-A, T-T (open symbols); G-G, C-C (full symbols) in the DNA sequences from H. Sapiens and Bacteria full genomes (in scaled form).
Dashed lines show the best fits by a  -exponential distribution
  . While in Bacteria the approximation by a single
  -exponential with
  and
and  is possible, in H. Sapiens a sum of two
  -exponentials with
  and
and  and 0.1 makes the best fit. To avoid overlapping, the PDFs for Bacteria are shifted downwards by two decades. For comparison, dotted lines show corresponding exponential PDFs.

