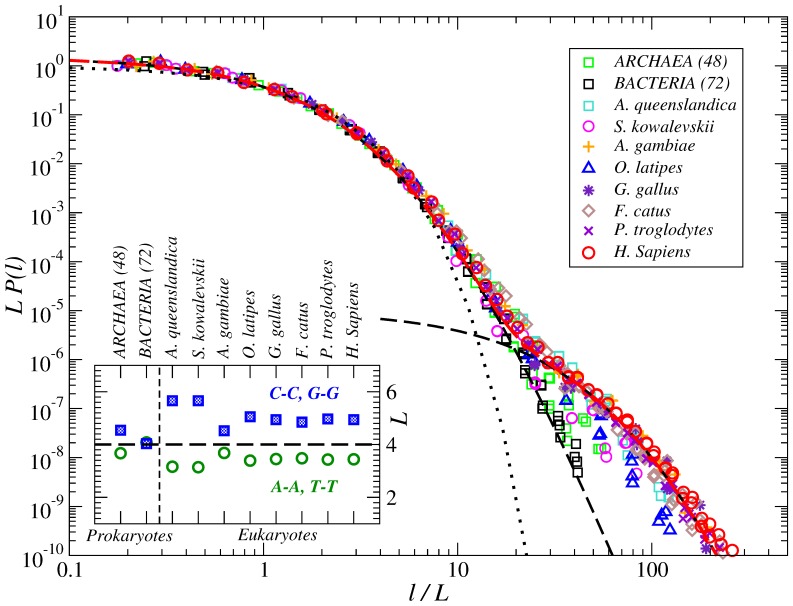
Figure 4. PDFs of the internucleotide intervals in the DNA from full genomes of ten different organisms at different evolutionary positions from Archaea and Bacteria to H. Sapiens.
The thin dashed line shows an approximation by a single  -exponential, while the thick dashed line shows an approximation by a sum of two
  -exponentials. For comparison, the dotted line shows the corresponding exponential PDF. The inset shows the evolution of the average interval
  separately for strongly (G:C) and weakly (A:T) bonded nucleotides.

