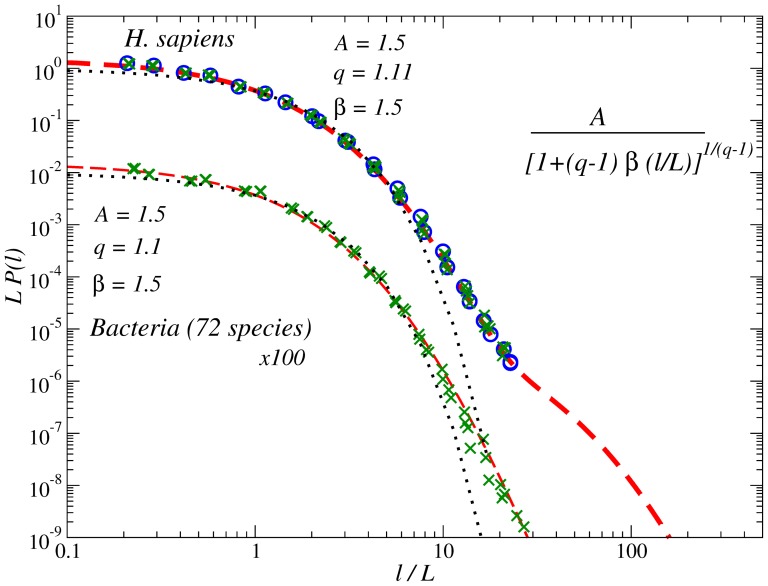
Figure 6. Similar to Fig. 3 but shows the corresponding PDFs for the transcribed DNA ( ) and for the complementary DNA (cDNA,
  ).
).
Fits are the same as in Fig. 3. To avoid overlapping, the PDFs for Bacteria are shifted downwards by two decades. For comparison, dotted lines show corresponding exponential PDFs.

