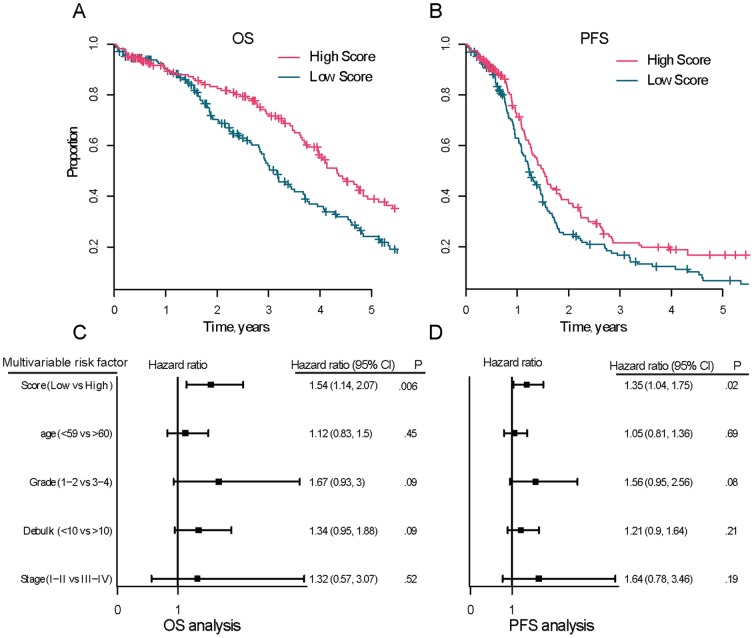
Figure 4. Ability of the genomic instability score to predict overall survival (OS) and progression-free survival (PFS) of ovarian cancer.
The TCGA dataset with somatic mutations and CNCs (n = 325) were analyzed and were divided into low and high scoring groups. Kaplan-Meier analysis was used to assess the OS (A) and PFS (B) in low versus high scoring group (log-rank p = .004 and p = .009, respectively). Multivariable analysis was performed using the Cox proportional hazards model to ensure that the score was independently prognostic for OS (C) and PFS (D). Solid squares represent the hazard ratio and the horizontal lines represent 95% confidence intervals (CI) of hazard ratios.

