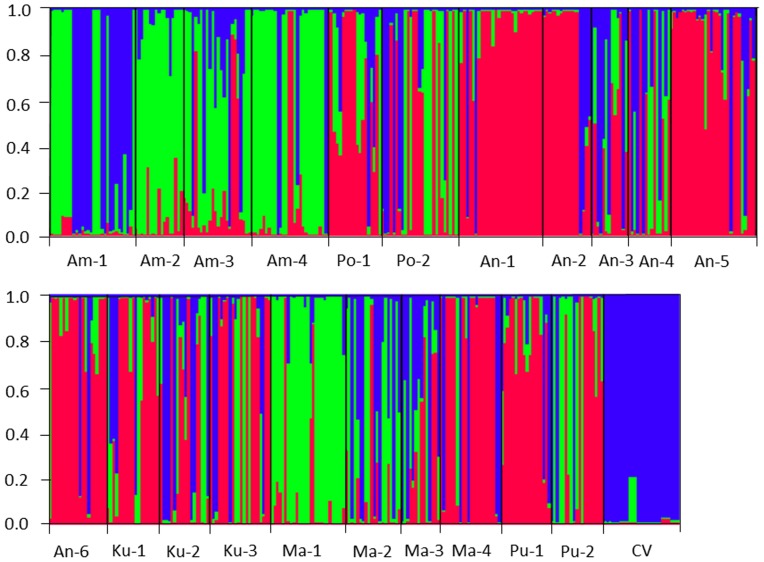
Figure 4. Genetic relationships of 21 weedy rice populations (Am-1 to Pu-2) and rice varieties (CV) from STRUCTURE analysis.
Each individual is represented by a vertical bar assigned into three colors, with height proportional to each of the three inferred genetic components. The numbers beside vertical axis represent probability of assignment.

