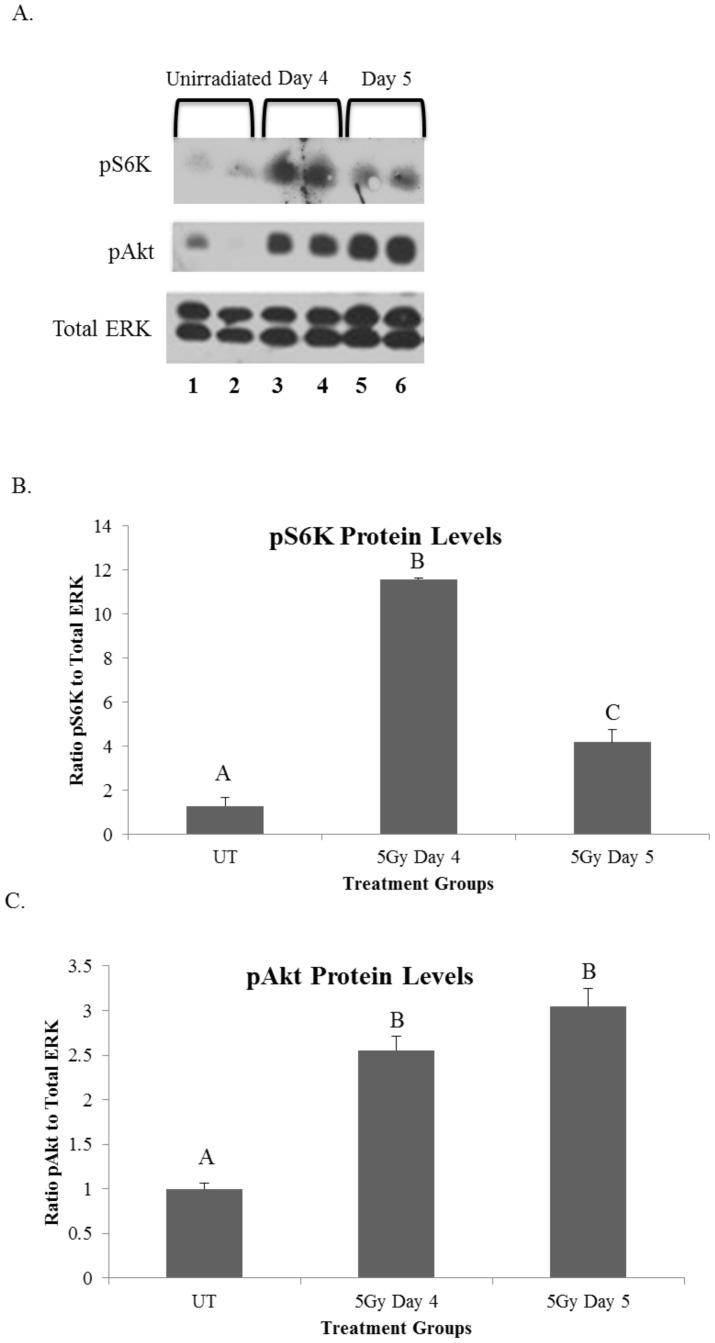
Figure 2. Radiation induces hyperactivation of the mTOR pathway 4–5 days following treatment.
On day 0 FVB wild-type mice were either unirradiated or treated with a single 5-Gy dose of targeted head and neck radiation. Letters above treatment groups are used to signify statistical significance; treatment groups with the same letters are not significantly different from each other. Significant differences (p<0.05) were determined using an ANOVA followed by a post-hoc Bonferroni multiple-comparison test. Data are presented as the mean ±SEM. A.) Parotid glands were collected at respective time points and protein was isolated to be used in immunoblots (representative blot shown) and probed for pS706K (top panel), pAkt (middle panel) or total ERK (bottom panel). B.) The graph represents the ratio of phosphorylated S6K to total ERK, which was quantified using densitometry. p<0.05, n≥3 per time point/treatment. UT: unirradiated. C.) The graph represents the ratio of phosphorylated Akt to total ERK, which was quantified using densitometry. p<0.05, n≥3 per time point/treatment. UT: unirradiated.

