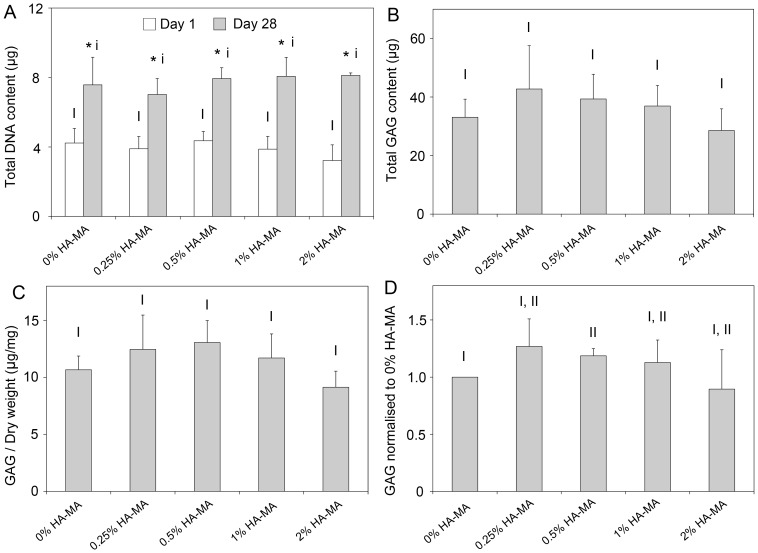
Figure 8. Biochemical analyses of cartilage constructs.
(A) DNA content of constructs on days 1 and 28. (B) Total GAG content in each hydrogel construct after 28 days of culture; (C) GAG content normalised to dry weight, and (D) GAG content normalised to the GAG content for 0% HA-MA hydrogels for each patient (D). Bars and error bars represent the means and standard deviations of four patients. Groups without a like Roman numeral are significantly different, and those with a like numeral are statistically similar. In (A), * indicates a significant difference in the DNA content in a hydrogel group between days 1 and 28.

