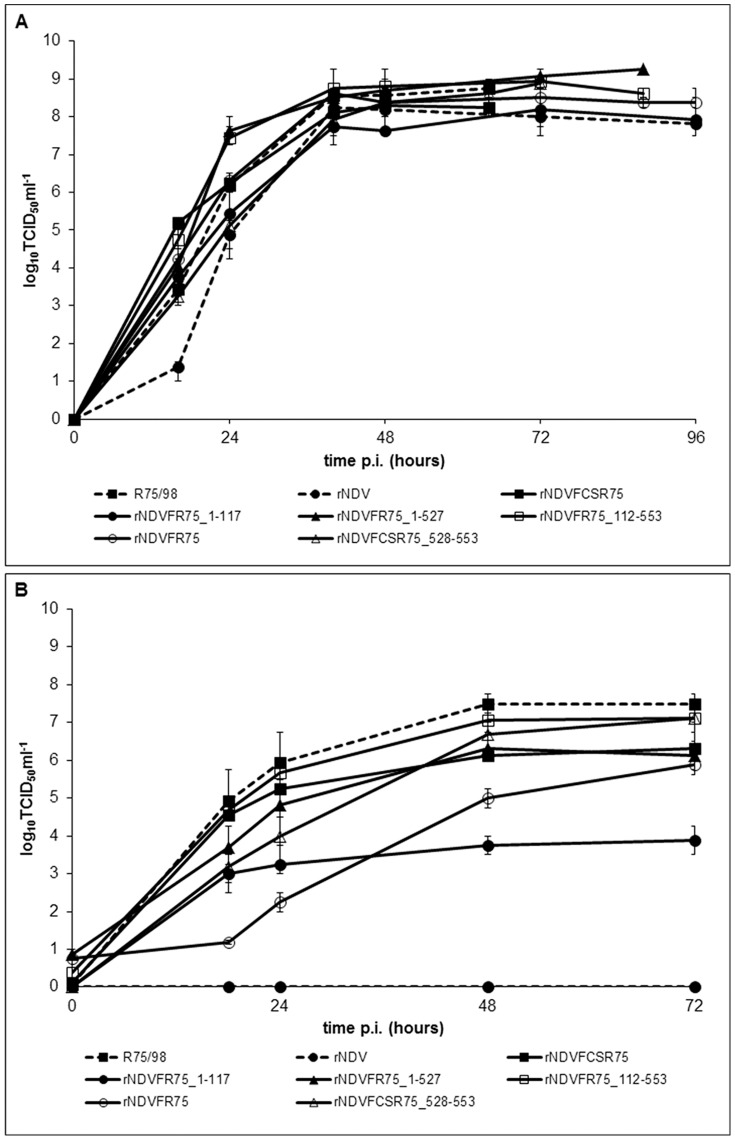
Figure 3. Kinetics of replication in ECE (A) and QM9 cells (B).
SPF eggs were infected with 200 µl of 103 TCID50 ml−1 and QM9 cells were infected at an moi of 0.01 with the respective viruses. Allantoic fluids of the eggs and cell culture supernatants were harvested at indicated time points and titers were determined by titration on QM9 cells, followed by immunofluorescence.

