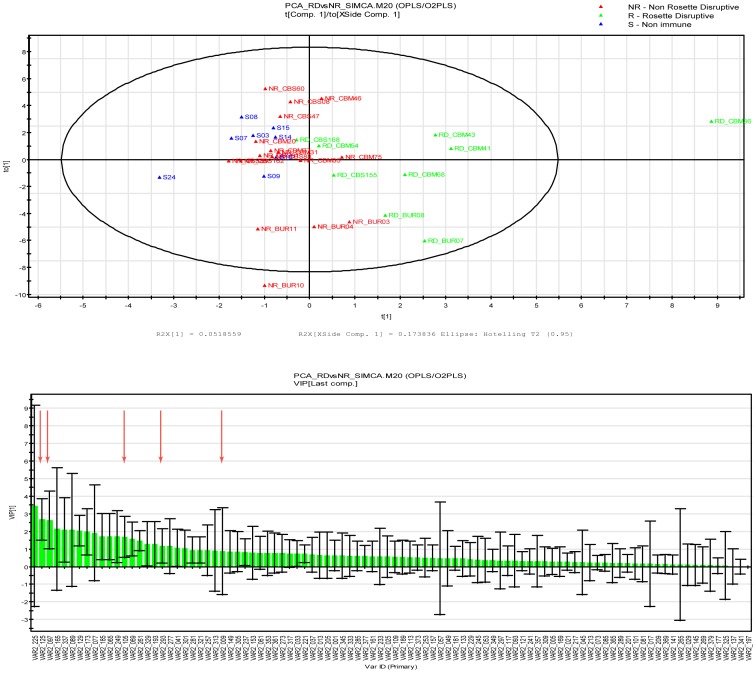
Figure 6. Orthogonal Partial Least Square analysis (OPLS) of peptide array data for It4var60.
Distribution of samples on the OPLS model according to their reactivity on the peptide array (top). VIP ranking score for the OPLS analysis (Bottom). Red arrows indicate the peptides correlated with the ability to disrupt rosettes as seen in figure 5.

