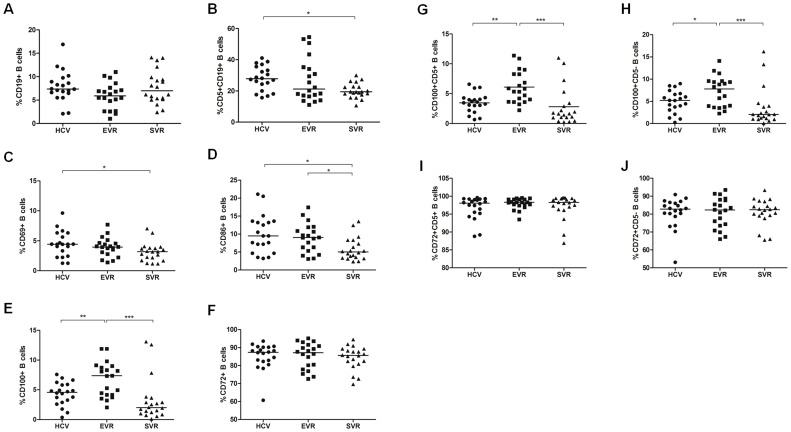
Figure 2. The percentages and phenotypes of altered B cells and their subsets in HCV patients after initiation of IFN-α/RBV treatment.
The frequency of (A) CD19+ B and (B) CD5+CD19+ B cells in patients with chronic HCV and healthy controls. The changes in (C) CD69, (D) CD86, (E) CD100 and (F) CD72 expression on B cells in chronic HCV-infected patients before and after antiviral treatment. (G–H) The expression of CD100 and (I–J) CD72 on the CD5+ and CD5- B cell subpopulations after initiation of IFN-α therapy. HCV (filled circles), EVR (filled squares) and SVR (filled triangles).

