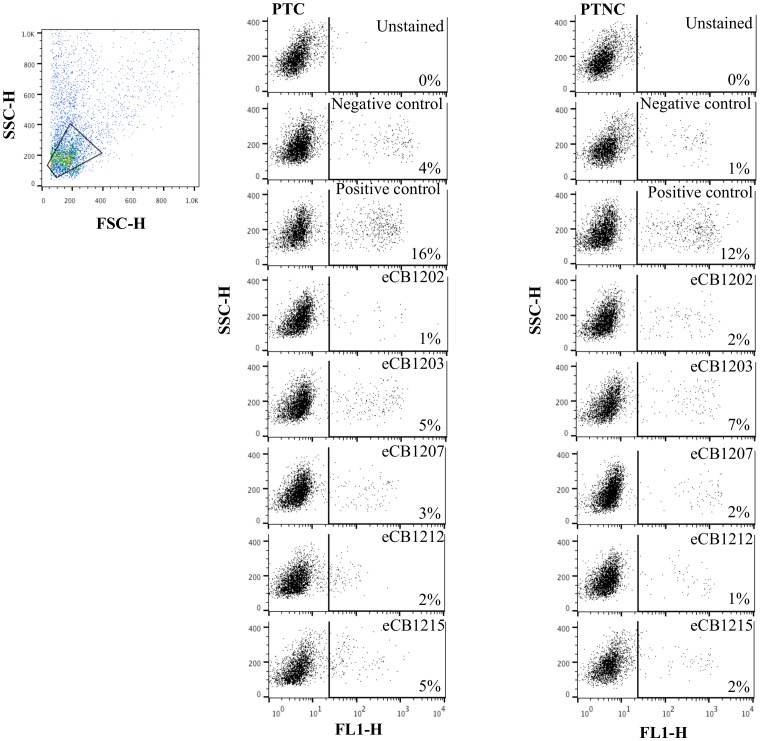
Figure 3. Cell proliferation during 2-way MLR was detected with a FITC-labelled antibody to BrdU.
Dot plots represent fluorescence of lymphocytes identified by forward and side scatter after co-culture with post-thaw-cultured (PTC) and post-thaw-non-cultured (PTNC) CB-MSC. The percentage fluorescence (right quadrant) indicates the proportion of lymphocytes proliferating in autologous (negative control), allogeneic (positive control) and allogeneic plus CB-MSC reactions. Differences in lymphocyte proliferation induced by PTC and PTNC CB-MSC were not significant.

