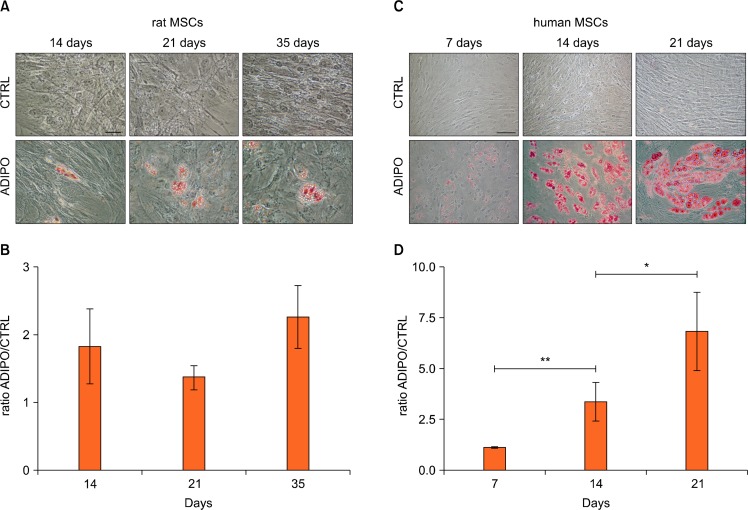
Fig. 2.
Adipogenic differentiation of rMSCs and hMSCs. Control (CTRL) and adipogenic induced (ADIPO) rMSCs (A) or hMSCs (C) were stained with Oil Red O respectively at days 14, 21 and 35 or at days 7, 14 and 21 after induction and micrographs were taken. Bars=50 μm. Quantitative analysis of Oil Red O dye accumulation in rMSCs (B) and in hMSCs (D) cultures. The results were normalized to the absorbance of untreated control cells and they are expressed as mean±Standard Deviation. **p<0.001; *p<0.05.

