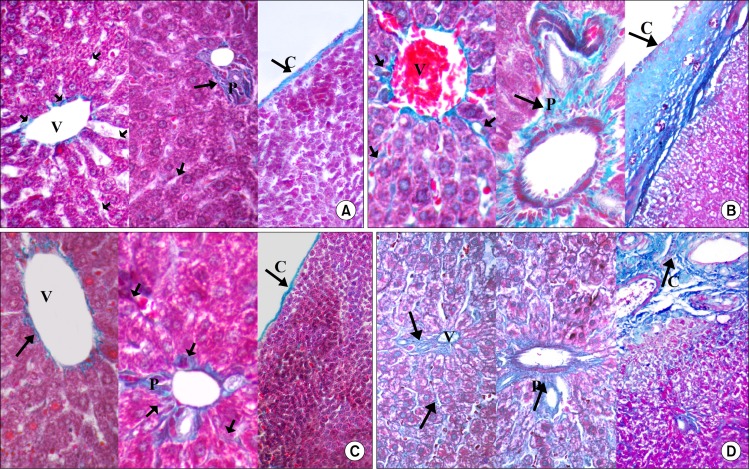
Fig. 2.
(A) Showing few collagen fibers (
 ) surrounding the central vein (V), in portal area (P) and in the capsule (C) in Control group. (B) Showing numerous collagen fibers (
 ) surrounding the central veins (V), in portal area (P) and in the capsule (C) in CCL4 alone group. (C) Showing the collagen fibers of CCL4/MSCs group which are comparable to that of the control group. (D) Showing numerous collagen fibers (↑) surrounding the central veins (V), in portal area (P) and in the capsule (C) in CCL4/Recovery group (Masson’s trichrome V×400, P×400, C×140).

