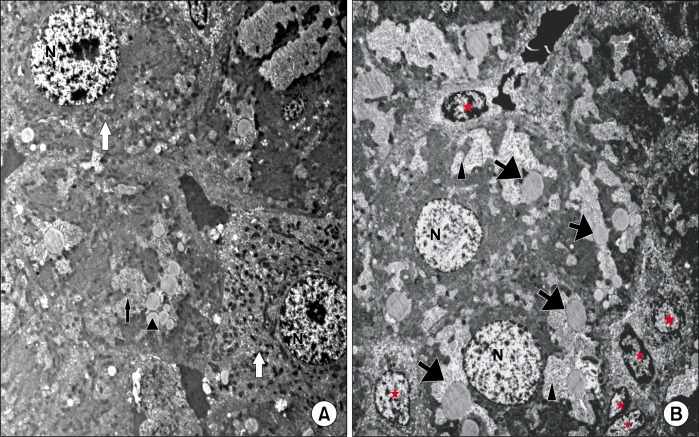
Fig. 6.
(A) Showing hepatocytes (white
 ) that are comparable to that of the control group. They contain many mitochondria and show usual distribution of chromatin in their nuclei (N). Small vacuoles (
 ) and few fat droplets (▲) are seen in some hepatocytes (CCL4/MSCs group TEM×4050). (B) Showing irregular large vacuoles (▲) and fat droplets (
 ) inside the cytoplasm of hepatocytes. The nuclei appear with abnormal chromatin distribution (N). Notice the presence of HSCs (*) with euchromatic nuclei in between hepatocytes (CCL4/Recovery group TEM×4050).

