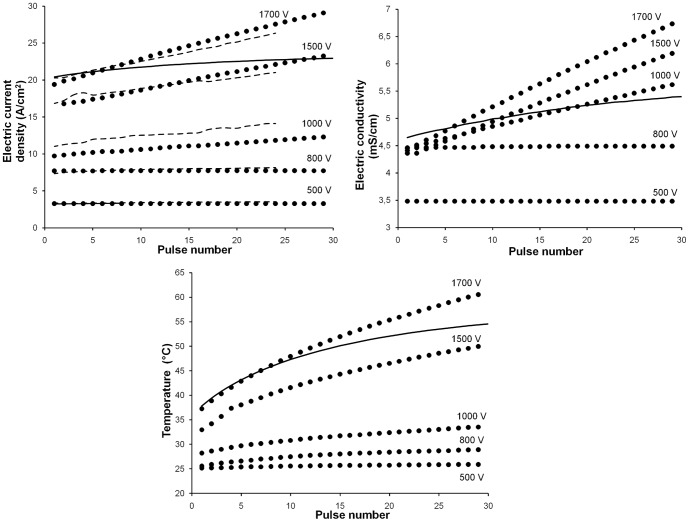
Figure 2. Temporal evolution of main variables.
a) Electric current density (A/cm 2), b) electric conductivity (mS/cm) and c) temperature (C) vs. pulse number for different square electric pulses (voltages of 500, 800, 1000, 1500 and 1700 V; 100 µs, 1 Hz). Circles: predicted values from the Fortran code. Dashed lines: experimental data from EP treatments in potato tissue. Standard errors were omitted for clarity. Solid lines: predictions from a model without the pulse-conductivity term for 1700 V.

