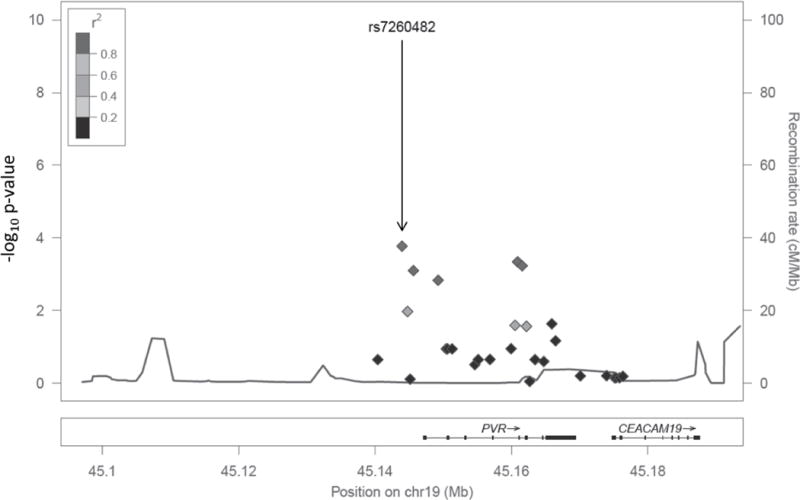
Figure 1. Locus-zoom plot of selected region of Chromosome 19.

A genetic region encompassing the PVR and CEACAM19 genes contained multiple SNPs significantly associated with rubella-specific IL-6 secretion following vaccination (Table 3). P-value is depicted on the left Y-axis. Each SNP is marked by the solid diamonds and LD (with respect to rs72604S2) is indicated by the grey color of the diamond (There are no SNPs with r2 between 0.6 – 0.8 or between 0.2 – 0.4). The recombination rate is mapped as the grey line at the bottom of the plot and on the right Y-axis. Underneath the plot each gene and its chromosomal position is indicated. Thick segments of each gene indicate exons, while the arrows indicate the direction of transcription.
