
FIGURE 1. Characterization of binding of CaM to V100-N in a Ca2+ -dependent manner assessed by analytical gel filtration.
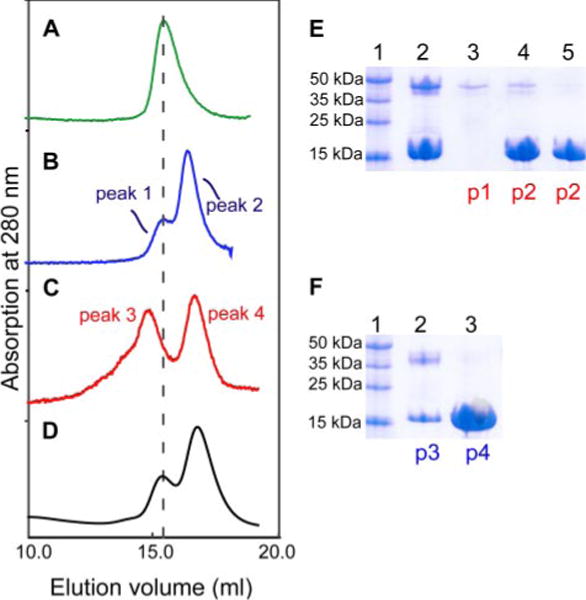
Left row shows the following chromatograms: A, V100-N (0.06 mM); B, V100-N (0.06 mM) and CaM (0.15 mM) eluted with a buffer containing 2 mM EDTA; C, V100-N and CaM (same molar ratio as in B) with the mobile phase containing 5 mM Ca2+; D, identical to C, but with V100-N F319A mutant. In B, C, and D chromatograms, the molar ratio of V100-N to CaM is 1:2.5 with identical volume (0.25 ml) of each protein mixture loaded onto the column. Right row (E and F) shows the results of the SDS-PAGE and Coomassie Blue staining of the different fractions from the gel filtrations. The fractions were concentrated to roughly the same volume. p1–p4 correspond to the different elution peaks identified in the gel filtrations (B and C profiles). E, lane 1, protein markers; lane 2, a mixture of Ca2+ ·CaM and V100-N before loading; lane 3, peak 1; lane 4, first fraction from the peak of peak 2; lane 5, second fraction from the descending slope of peak 2. F, lane 1, protein markers; lane 2, peak 3; lane 3, peak 4.