
FIGURE 2. Binding of CaM to V100 CBD peptide assessed by Trp fluorescence.
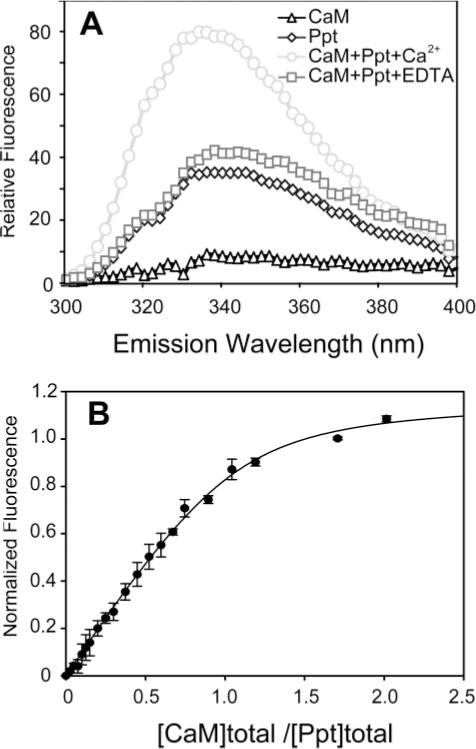
A, fluorescence emission spectra of CaM (0.3 μM, triangle) and the CBD peptide (314NWFVKVRKIKAIYHTLNLFNLD338) of segment 2 (named Ppt) (0.3 μM, diamond) and their complex in the presence of 5 mM Ca2+ (circle) or 10 mM EDTA (square). The spectra were obtained in 5 mM NaCl and 20 mM HEPES, pH 7.5 (see “Experimental Procedures”). The fluorescence emission was measured from 300 to 400 nm with the excitation wavelength set at 295 nm. B, fluorescence titration of Ca2+ ·CaM to V100 CBD peptide. The titration curve, using the normalized change in fluorescence at 340 nm, was fitted as described in “Experimental Procedures.” The fitting correlation coefficient (R2) is 0.98.