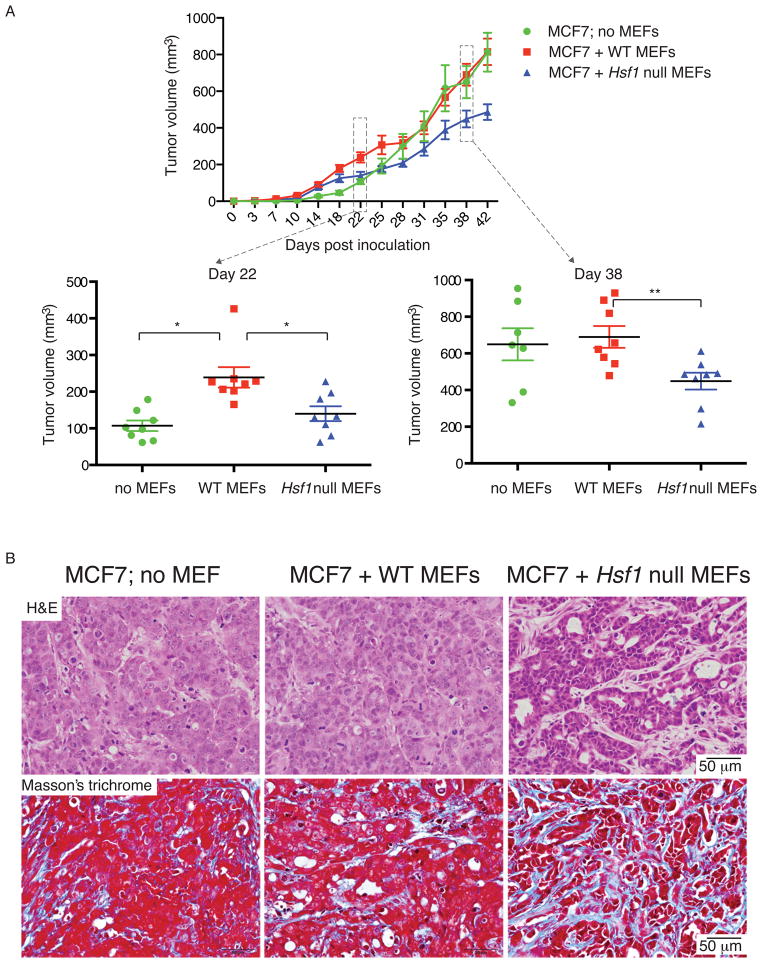
Figure 2. Stromal Hsf1 status alters tumor progression and histology in human breast xenografts.
MCF7 breast cancer cells alone or mixed with WT or Hsf1 null primary MEFs were injected subcutaneously into NOD-scid mice. The experiment was repeated twice, with 4 mice per group in each experiment. (A) The mean tumor volume (total 8 per treatment group) is shown. The distribution of individual measurements is shown in the lower panels, in scatter plots for days 22 and 38 post injection. Error bars, SEM. *p<0.05, **p<0.01. (B) Mice were sacrificed when tumor burden reached size limit and the tumors were excised, fixed and stained with hematoxylin & eosin (H&E, upper panels) or Masson’s trichrome stain (lower panels). All images collected at the same magnification. Scale bar = 50μm. See also Figure S2.

