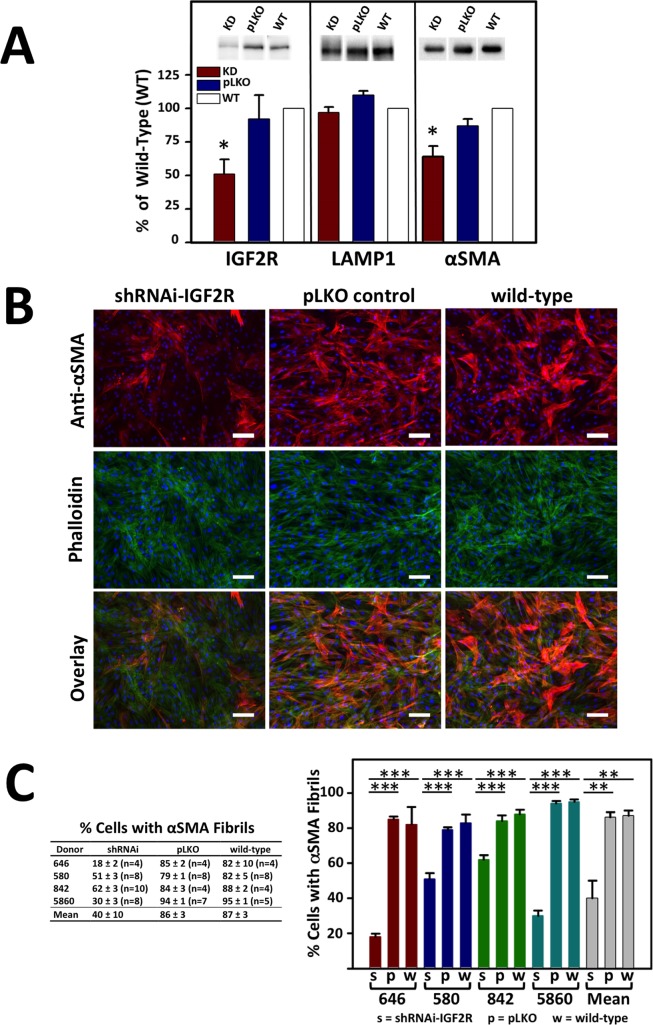
Figure 6.
α-SMA fibril formation in primary human corneal myofibroblasts following transduction with control (pLKO) or shRNA-IGF2R lentiviral particles (KD). Lentiviral particle transduced or nontransduced cells (WT) were cultured in 1 ng/mL TGF-β1 for 7 days under serum-free conditions. (A) Lysates were generated and subjected to Western blot analysis (equivalent cell numbers loaded into each lane). Membranes were probed with IGF2R-, α-SMA-, or LAMP1-specific antibodies. Quantification is shown below the representative blots and is derived from corneal cultures obtained from four independent donors. Data are plotted as a percentage of the intensity of IGF2R, α-SMA, or LAMP1 bands in the shRNAi-IGF2R KD cells and cells transduced with pLKO control vector relative to nontransduced WT cells set to 100%. Values represent the mean ± SE. The Student's t-test was used to compare the IGF2R KD cells to the pLKO control cells. *P < 0.02, n = 4. (B) Fixed cells were incubated with antibody specific to α-SMA that was visualized using a goat anti-mouse secondary antibody conjugated to Alexa Fluor 568 (red) and FITC-conjugated phalloidin (green). Nuclei were stained with Hoescht 33342 dye. An overlay of the phalloidin and α-SMA–stained cells is shown in the bottom. Representative micrographs are shown. Scale bar: 100 μm. (C) The images from the studies shown in (D) were quantified for the number of cells containing α-SMA fibrils. Approximately 200 to 500 cells per micrograph were scored for the presence of α-SMA–containing fibrils. The percentages shown are derived from four independent donors and are the average for the indicated number (n) of individual micrographs. The mean of the data derived from the four independent human donors also is shown. Values represent the mean ± SE. ANOVA, P < 0.001, individual comparisons use the Holm-Sidak method, **P = 0.002, ***P < 0.001.

