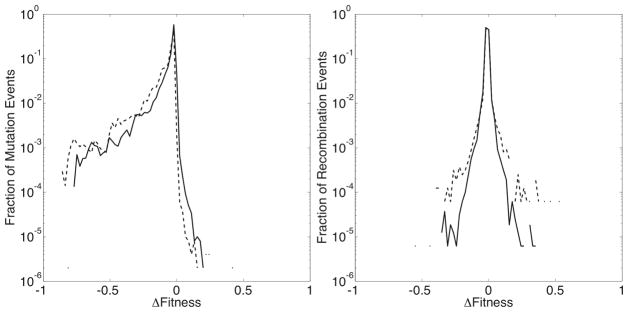
Fig. 5.

The observed distributions of Δsmut and in the first and last 500 generations of experiments with ρ = 0.1. Solid lines represent the distributions corresponding to the first 500 generations of the experiment, dashed lines represent those corresponding to the final 500 generations. (a): Distribution of Δsmut and (b): .
