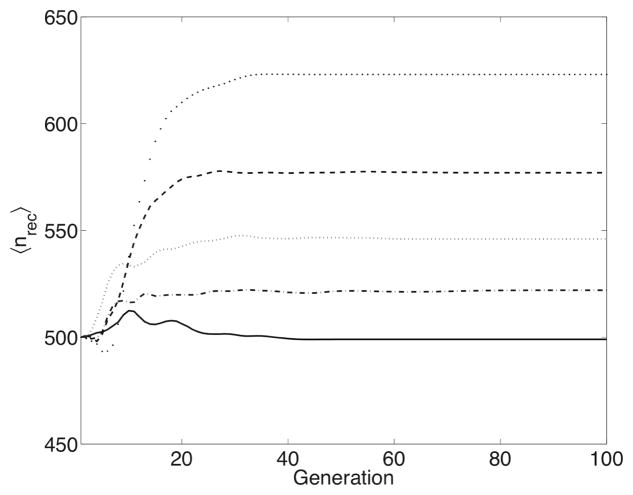
Fig. 7.
Time-course of 〈nrec〉, the experimental-wide average size of the subpopulation with recombination, color-coded by the value of ρ. The control experiment without recombination, ρ = 0.0 (solid line), ρ = 0.001 (dash-dot line), ρ = 0.01 (dotted line), ρ = 0.1 (dashed line), ρ = 1, (large dots).

