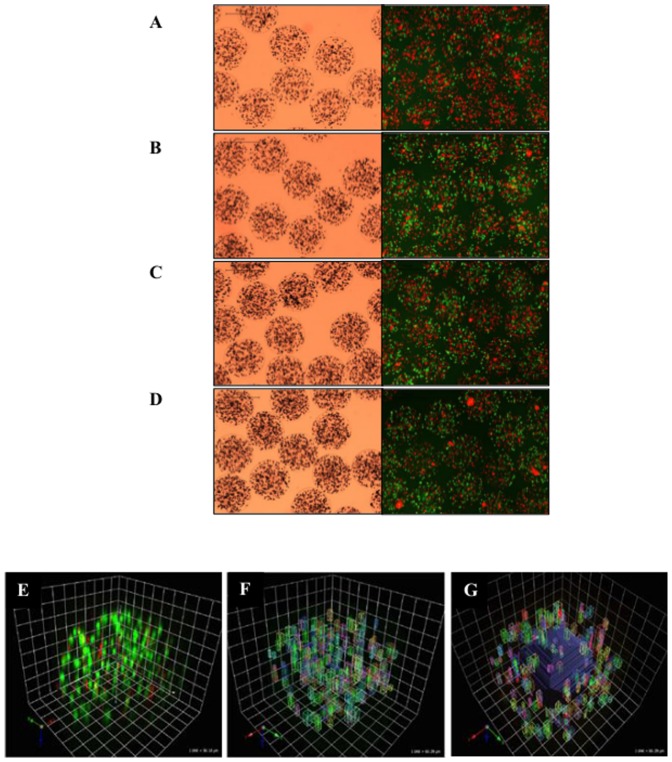
Figure 1. Distribution of human hepatocytes in alginate-hepatocyte microbeads.
Representative image of HMBs produced with different cell densities; 2.0, 2.5, 3.0 and 3.5×10⁶ cells/ml alginate (A, B, C, and D respectively) under light microscopy (left) and fluorescence microscopy (right). Representative confocal microscopy images used in 3D reconstruction to demonstrate (E & F) cell distribution and viability across the microbead, and (G) viability of cells within outer half vs inner half of same microbead. Green; viable and red; dead cells.

