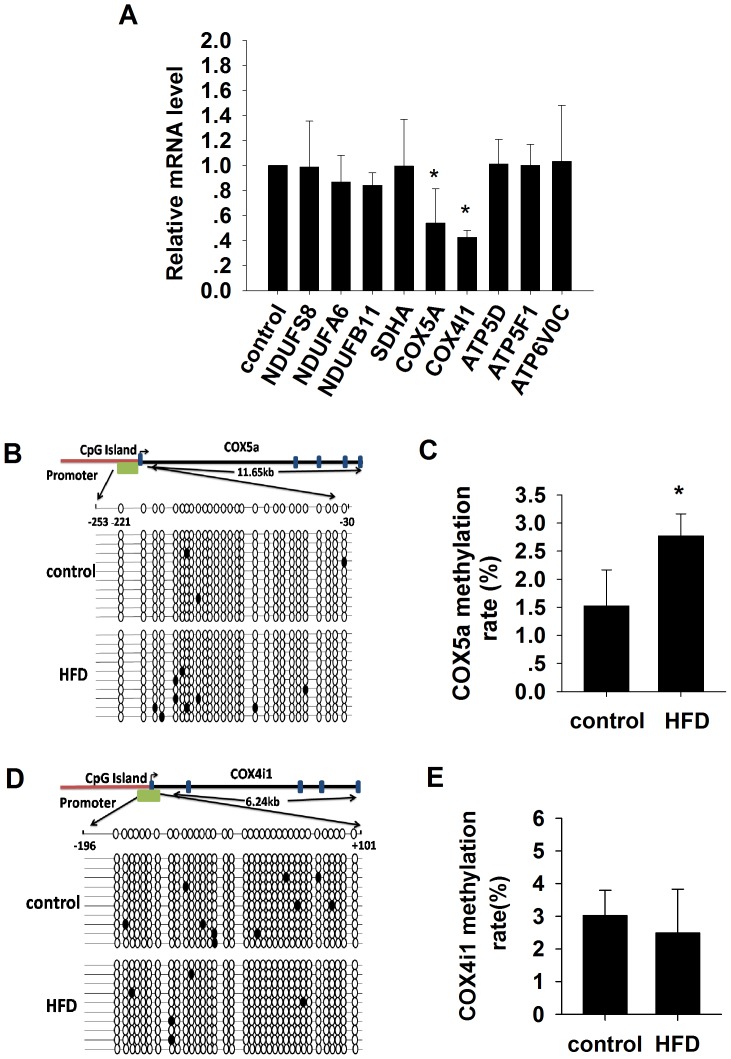
Figure 2. The mRNA levels of the 9 OXPHOS genes and methylation analysis of the Cox5a and Cox4i1 promoter by bisulfite sequencing.
(A) Real-time PCR quantification of the 9 OXPHOS genes in skeletal muscle samples from control group and high-fat diet (HFD)-induced insulin resistant rat. Mean±SD. N = 4–7/group. *p<0.05 vs control. (B–C) Graphic representation and the results of the bisulfite-sequenced portion on the Cox5a gene. Mean±SD. (n = 7/group. ANOVA, *p<0.05 vs control). (D–E) Graphic representation and the results of the bisulfite-sequenced portion on the Cox4i1 gene. Mean±SD. (n = 7/group. ANOVA, *p<0.05 vs control).

