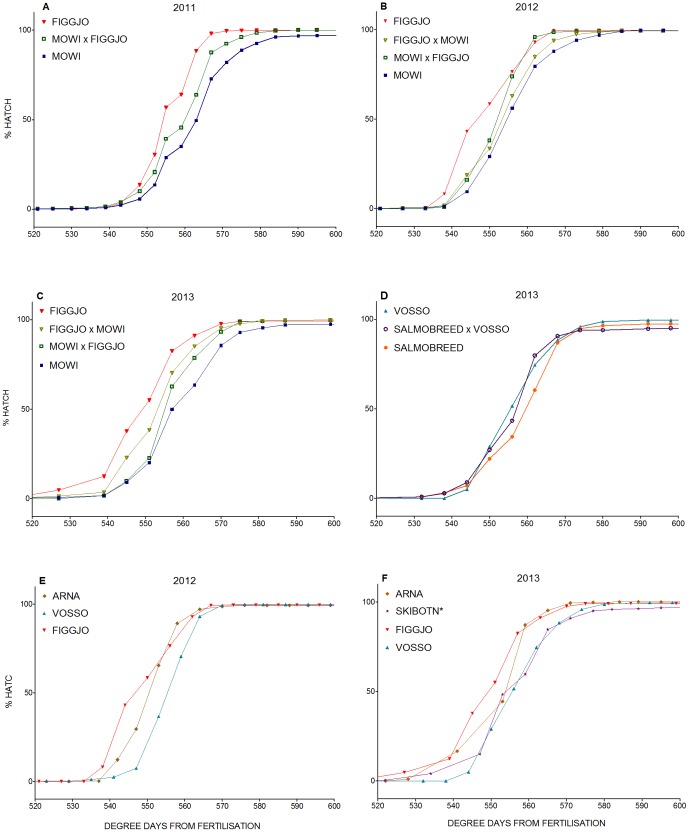
Figure 3. Embryonic development rate.
Mean cumulative degree-days from fertilisation to percentage hatch in the; A) Figgjo/Mowi cross C2011, B) Figgjo/Mowi cross C2012, C) Figgjo/Mowi cross C2013, D) Vosso/SalmoBreed cross C2013, E) wild strains C2012, and F) wild strains C2013. See Table 3, 4 and File S2 for the adjoining statistical results.

