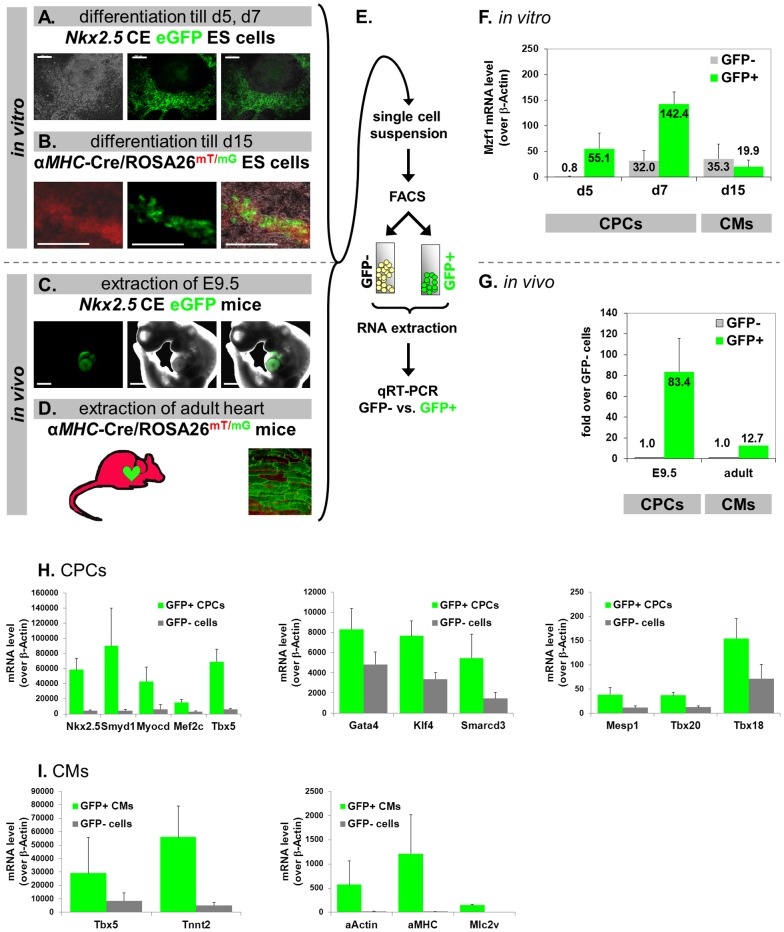
Figure 4. Differential expression of Mzf1 in cardiac progenitor cells (CPCs) but not in cardiomyocytes (CMs) and gene expression profiles of in vitro differentiated CPCs and CMs.
Scale bars: 200 µm for all panels, except C: 500 µm. A.-D. Detection of CPCs and mature CMs by activation of eGFP expression. Illustration of transgenic cell lines (A.–B.) and animal models (C.–D.). E. Experimental set-up for isolating eGFP-positive and -negative cell populations by FACS. F. Gene expression analysis after FACS sorting of in vitro differentiated Nkx2.5 CE eGFP ES cells (A.) revealed a considerable up-regulation of Mzf1 in eGFP+ CPCs but not for mature CMs (B.) compared to the respective eGFP− cells. G. Correspondingly, Mzf1 expression was up-regulated in eGFP+ CPCs isolated from E 9.5 embryos (C.) but not to a comparable amount in mature CMs isolated from postnatal (> 3 weeks) hearts (D.) compared to the respective eGFP− cells. H. Nkx2.5 CE eGFP ES cells were differentiated till day 5–7. GFP positive (CPCs) and GFP negative cells were sorted by FACS. Gene expression profiles of typical cardiac developmental marker genes (Nkx2.5, Mef2c, Gata4, Tbx20, etc.) were evaluated by qRT-PCR. I. αMHC-Cre/ROSA26mT/mG ES cells were differentiated till day 15. GFP positive (CMs) and GFP negative cells were sorted by FACS. Gene expression profiles of typical cardiac and sarcomeric marker genes (Tnnt2, αMHC, etc.) were evaluated by qRT-PCR.

