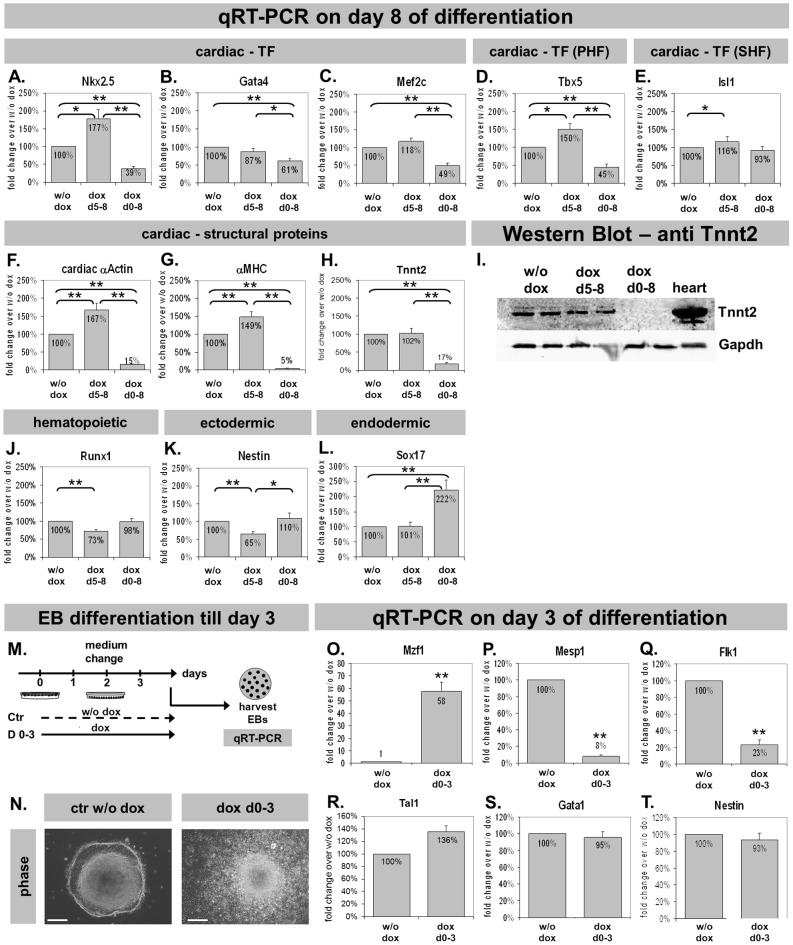
Figure 6. Gene expression analysis during in vitro differentiation of tetOMzf1-Nkx2.5 CE eGFP ES cells.
* = p<0.05; ** = p <0.01 for all panels. A–H. Expression of selected cardiac genes. PHF: primary heart field. SHF: secondary heart field. I. Protein expression by western-blotting for Tnnt2 and Gapdh. J–L. Expression of selected hematopoietic (J.), ectodermal (K.) and endodermal (L.) genes. M. Experimental set-up for day three in vitro differentiation assays. N. Morphology of differentiating EBs on day three. Dox-treatment for three days increased cell proliferation. Scale bars indicate 200 µm. O–T. Gene expression analysis of Mzf1 (O.), Mesp1 (mesodermal) (P.), Flk1 (cardiovascular progenitor marker) (Q.), Tal1, Gata1 (hematopoietic marker) (R., S.) and Nestin (ectodermal) (T.).

